
The views expressed in Shorenstein Center Discussion Papers are those of the author(s) and do not necessarily reflect those of Harvard Kennedy School or of Harvard University. This paper was originally published by the Institute for Policy Research at Northwestern University.
Download a PDF version of this paper here.
Abstract
Two of the most significant concerns about the contemporary United States are the erosion of democratic institutions and the increase in rates of depression. The researchers provide evidence linking these phenomena. They use a survey (N=11,517) to show a relationship between COVID-19 conspiracy beliefs and the endorsement of the 2020 election fraud claim as well as voting, in 2022, for gubernatorial candidates who cast doubt on the 2020 election results. The authors further predict and find that the presence of severe depressive symptoms exacerbates these relationships. An increase in depression among COVID-19 conspiracy believers is positively associated with voters casting their ballots for candidates who question the foundation of democratic legitimacy. The results highlight how interventions to address mental health can improve the country’s political health.
Democracy, at a minimum, requires the peaceful transfer of power based on election results. That did not occur in the U.S. in 2020, given the violent insurrection of January 6th, 2021. Concerns remained in 2022 with gubernatorial candidates in 28 states (of the 36 states holding gubernatorial elections) casting doubt, without credible evidence, on the legitimacy of the 2020 election.1See https://www.pbs.org/newshour/elections-2022/gop-election-deniers This is concerning given states have, until recently, been seen as laboratories of democracy. A burgeoning literature identifies variables that lead voters to believe in electoral fraud2K. Arceneaux, R. Truex, Donald Trump and the lie. Perspect. Politics, 1–17 (2022). doi:10.1017/S1537592722000901. and to support undemocratic candidates.3J.G. Voelkel, et al. Megastudy identifying successful interventions to strengthen Americans’ democratic attitudes.” (2023). https://www.strengtheningdemocracychallenge.org/paper One such factor is holding conspiracy beliefs.4A.M. Enders, et al. The 2020 presidential election and beliefs about fraud. Elect. Stud. 72, 102366 (2021). This echoes evidence that conspiracy beliefs in one domain (e.g., COVID-19) correlate with subscribing to conspiracies in other domains (e.g., electoral).5R.M. Sutton, K.M. Douglas. Conspiracy theories and the conspiracy mindset. Curr. Opin. Behav. Sci. 34, 118-122 (2020).
We posit that experiencing severe depressive symptoms (Methods)—a condition that has increased substantially over the last four years6R.H. Perlis, et al. 2021. A 50-State COVID-19 survey report #54. https://www.covidstates.org/reports/mental-health-in-the-united-states. — shapes the relationship of non-electoral conspiracy beliefs with both conspiratorial electoral beliefs and voting. Major depression manifests with individuals experiencing persistent feelings of sadness and hopelessness. Depression is often accompanied by a perceived loss of control. This leads to a feeling that outcomes depend on powerful others or chance.7C. Cheng, et al. Cultural meaning of perceived control. Psychol. Bull. 139, 152-188 (2013). While depression often demobilizes,8C. Landwehr, C. Ojeda. Democracy and depression. Am. Polit. Sci. Rev. 115, 323-330 (2021). conspiratorial thinking can activate people: it stimulates thoughts of powerful others pursuing malevolent goals as a cause for the loss of control.9C. R. Sunstein, A. Vermeule. Conspiracy theories. J. Polit. Philos. 17, 202-227 (2009).10J-W. van Prooijen, K.M. Douglas. Conspiracy theories as part of history. Mem. Stud. 10, 323-333 (2017). Addressing or acting against these others is a way to regain control.
We expect a stronger relationship across conspiracy theory domains among those with severe depression, relative to those without (Hypothesis 1). This occurs because such individuals invoke additional conspiracies toward other actors to address their loss of control. Further, those who are experiencing severe depression (and holding conspiracy beliefs), relative to those who are not, will be more likely to act against public figures perceived as having malevolent goals (Hypothesis 2). Action enables them to regain control by removing actors they view as limiting their control.11M.A. Baum, et al. The political consequences of depression. Am. J. Polit. Sci., Forthcoming. Given our political focus, we expect the two hypotheses to hold particularly for men (Hypothesis 3). Relative to women, men view politics more as a domain where they can assert influence and hence regain control over perceived injustices.12M.A. Baum, et al. The political consequences of depression. Am. J. Polit. Sci., Forthcoming. 13J. Wolak. Self-confidence and gender gaps in political interest, attention, and efficacy. J. Polit. 82, 1490-1501 (2020).
Results
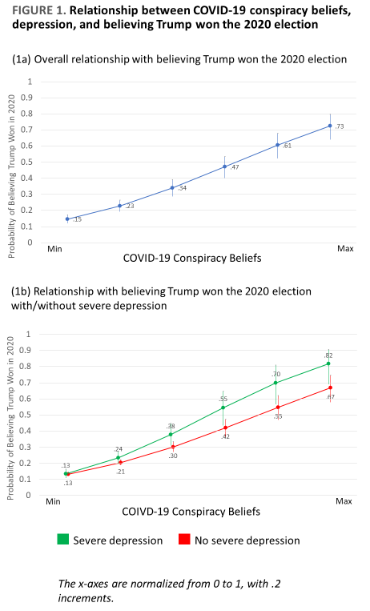
We test Hypothesis 1 by exploring the relationship between conspiracy beliefs about COVID-19 vaccines (5-items) and the conspiracy belief that Trump won the 2020 election, as moderated by the experience of severe depression (Methods). This 2020 election belief is a conspiracy, suggesting actors took covert action to obtain power.14H. Wang, J-W. van Prooijen. Stolen elections. Appl. Cognitive Psych. 37, 277-289 (2023). We focus on vaccine- related conspiracies that are arguably more exogenous to election denial than overtly political conspiracies. All results come from statistical models that control for a range of variables (Methods). The effects are thus net of variables correlated with beliefs about election conspiracies (e.g., partisanship) and COVID-19 conspiracies (e.g., vaccination status).
Figure 1’s top panel reveals a strong relationship between the conspiracies: a 58- percentage point increase (.15 to .73, p<.001) in the probability of believing Trump won the 2020 election, as one moves from endorsing no COVID-19 vaccine conspiracies to endorsing them all. Consistent with Hypothesis 1, Figure 1’s bottom panel shows a significantly stronger relationship between the two conspiracy domains among those with severe depression compared to those without. At higher levels of COVID-19 conspiracies, the gap in effects between those with versus without severe depression reaches about 15-percentage points (p<.01).
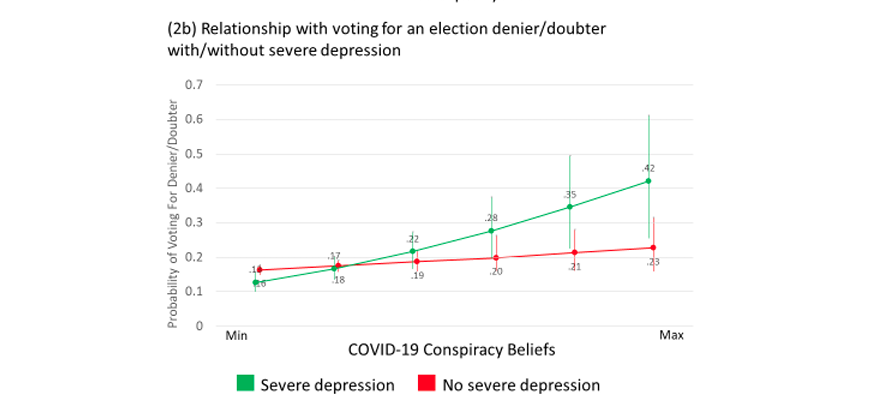
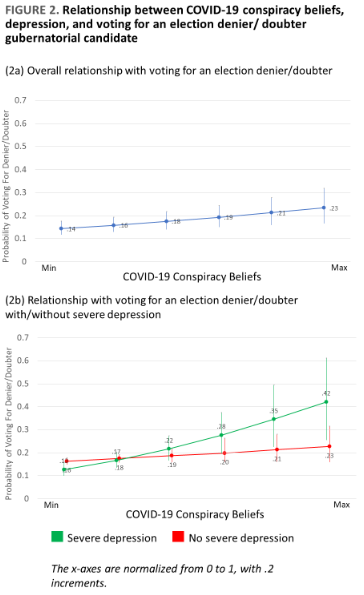
We next examine whether an eligible voter preferred a 2022 gubernatorial candidate who denied or cast doubt upon the legitimacy of the 2020 election (i.e., a candidate who would triumph over actors viewed as condoning fraud in 2020). Figure 2’s top panel reveals a moderate relationship between COVID-19 vaccine conspiracies and the likelihood of voting for an election denying/doubting candidate. As vaccine conspiracy beliefs increase from their minimum to maximum values, the probability of voting for such a candidate increases by 9 percentage points (.14 to .23; p<.01). Consistent with Hypothesis 2, Figure 2’s bottom panel shows that severe depression conditions that relationship. Among respondents who do not suffer from severe depression, variations in conspiracy beliefs have some association with the likelihood of voting for deniers/doubters (a maximum 7-point increase in likelihood of voting for a denier/doubter; p<.10). However, among severely depressed respondents, we see a far stronger relationship between conspiracy beliefs and voting. We find a maximum of a more than threefold increase in the likelihood of voting for a denier or doubter (.13 to .42; p<.01). The difference in the magnitudes of the effects of conspiracy beliefs on the probability of voting for election deniers/doubters between those with and without severe depression is itself significant (p<.05).
Turning to Hypothesis 3, among men without severe depression, the probability shift in voting for a denier or doubter as COVID-19 conspiracy beliefs increase from the minimum to maximum is .04. For men with severe depression, that shift rises to .35 (p<.01). The respective shift in probabilities of believing Trump won in 2020 are .53 and .78 (p<.05). The presence of severe depression clearly exacerbates the relationship with conspiracy beliefs. This is not the case for women where the parallel probabilities are .11 and .23 for voting, and .51 and .38 for the electoral conspiracy belief (a decrease), with neither difference reaching significance.
Discussion
Unprecedented rates of depressive symptoms and election denialism have led to substantial concern about America’s mental and political health. While some work explores the connection between politics and mental health (7,10), that depression can contribute to democratic erosion has not been documented. Our results suggest it can play a role—even when it comes to what may be the most consequential way that citizens influence democratic stability (i.e., voting). Our findings clarify a research agenda that integrates public health with democratic functioning. The next step would be to document the causal patterns and mechanisms. A practical implication is that investment in treating depression (and not stigmatizing those who suffer from it) has benefits for individuals and communities as well as for democratic stability.
Methods
Our data come from a survey conducted between 6 October and 9 November 2022. Our models include eligible voters who lived in a state with at least one election denier/doubter on the gubernatorial ballot (N=11,517) (using sampling weights; SI). The “Trump won” models are robust to including respondents from all states and the vote model is robust to adding belief that Trump won as an independent variable (SI). The COVID-19 vaccine conspiracy battery queried beliefs in five claims (e.g., vaccines will alter people’s DNA) with scores equaling the number of conspiracies endorsed (normalized on a 0-1 interval). The “Trump won” item asked respondents whether they agreed that Trump had really won the 2020 election. The vote choice item is 1 if a respondent voted for a candidate who publicly denied Biden won the 2020 election or questioned the election’s integrity, and 0 otherwise (as identified by PBS coding). Depression was measured with the Patient Health Questionnaire (PHQ-9), which is used to screen patients in primary care settings (e.g., diminished interest, sleep difficulties). We employed the common threshold of 15 (/27) to indicate moderately severe to severe depression, which we call “severe.”15K. Kroenke, R.L. Spitzer. The PHQ-9. Psychiat. Ann. 32, 509-515 (2002). The figures in the paper come from logit models, with the second panels adding a conspiracy X depression interaction. All models control for income, gender, race/ethnicity, education, age, partisanship, ideology, political interest, following politics, election confidence, support for political violence now or ever, voting turnout, COVID-19 vaccination, and frequency of discussing COVID-19. The SI provides details on the sample, question wordings, and models.
References
- K. Arceneaux, R. Truex, Donald Trump and the lie. Perspect. Politics, 1–17 (2022). doi:10.1017/S1537592722000901.
- J.G. Voelkel, et al. Megastudy identifying successful interventions to strengthen Americans’ democratic attitudes.” (2023). https://www.strengtheningdemocracychallenge.org/paper
- A.M. Enders, et al. The 2020 presidential election and beliefs about fraud. Elect. Stud. 72, 102366 (2021).
- R.M. Sutton, K.M. Douglas. Conspiracy theories and the conspiracy mindset. Curr. Opin. Behav. Sci. 34, 118-122 (2020).
- R.H. Perlis, et al. 2021. A 50-State COVID-19 survey report #54. https://www.covidstates.org/reports/mental-health-in-the-united-states.
- C. Cheng, et al. Cultural meaning of perceived control. Psychol. Bull. 139, 152-188 (2013).
- C. Landwehr, C. Ojeda. Democracy and depression. Am. Polit. Sci. Rev. 115, 323-330 (2021).
- C. R. Sunstein, A. Vermeule. Conspiracy theories. J. Polit. Philos. 17, 202-227 (2009).
- J-W. van Prooijen, K.M. Douglas. Conspiracy theories as part of history. Mem. Stud. 10, 323-333 (2017).
- M.A. Baum, et al. The political consequences of depression. Am. J. Polit. Sci., Forthcoming.
- J. Wolak. Self-confidence and gender gaps in political interest, attention, and efficacy. J. Polit. 82, 1490-1501 (2020).
- H. Wang, J-W. van Prooijen. Stolen elections. Appl. Cognitive Psych. 37, 277-289 (2023).
- K. Kroenke, R.L. Spitzer. The PHQ-9. Psychiat. Ann. 32, 509-515 (2002).
Supporting Information
Table of Contents
Survey Details
Sample
Coding Election Denying or Doubting Candidates Figure 1 and Figure 2 Models
Robustness Check Models
Gender Models
Question Wording
Supporting Information References
Survey Details
We recruited respondents through the PureSpectrum survey recruitment platform, which aggregates and deduplicates paid panelists from multiple online survey sources. Though not a probability sample, the large scale of the sample and its demographic breadth allows considerable flexibility for including quotas for gender, race, and age at the state level and reweighting of observations to match official U.S. Census figures. Emerging evidence suggests this methodology can perform as well as traditional probability sampling (Radford et al. 2020, Enns and Rothschild 2021, Lehdonvirta et al. 2021).
Sample
Our weighted (full) sample included 51.7% women, and 48.3% men; 64.9% White, 12.4% Black or African American, 5.9% Asian American, and 15.7% Hispanic or Latino; 26.4% 20-34 years old, 32.9% 35 to 54 years old, 29.3% 55 to 74 years old, and 11.4% 75 years old or older; and 6.7% some high school or less, 27.9% high school graduate, 26.1% some college, 24.6% college degree, and 14.7% graduate degree. The respective percentages from the 2021 American Community Survey (ACS) are 50.5%, and 49.5%; 68.2%, 12.6%, 5.7%, and 18.4%; 27.1%, 34.1%, 30.2%, and 8.6%; 11.1%, 26.5%, 20.0%, 29.3%, and 13.1%. (The education data are for individuals 25 years old or older.) Across categories, the sample matches the ACS benchmarks fairly well. The largest discrepancies are that the sample includes more older people (and fewer middle-aged people) and fewer without a high school degree (and more with some college). These are well-known limitations of any survey sampling procedure, not just ours. Most notably, the least-educated are less likely to be online. There also are ostensibly fewer Hispanic or Latino people but that likely reflects the question we report here does not have a distinct item that asked about being Hispanic or Latino (i.e., it is one category for the overall question whereas for the ACS, it is a separate question).
Otherwise, 13% of the sample crossed the threshold for severe depression.
Coding Election Denying or Doubting Candidates
Claims of election fraud in 2020 began well before Election Day. Throughout the campaign, Trump claimed the election was being stolen from him using mail-in ballots. He even remarked, perhaps most famously, during the first presidential debate with Joe Biden: “As you know, today there was a big problem. In Philadelphia, they [my supporters] went in to watch. They’re called poll watchers, a very safe, very nice thing. They were thrown out. They weren’t allowed to watch. You know why? Because bad things happen in Philadelphia” (Commission on Presidential Debates 2020). While this was perhaps his most egregious example, it fit into a larger pattern of trying to delegitimize the election (Annenberg IOD Collaborative 2023). No credible evidence was ever produced, and courts rejected more than 60 claims of election fraud by Trump and his supporters. Even so, the conspiratorial claim that Joe Biden stole the 2020 election from the rightful winner, Donald Trump—has garnered widespread support in the Republican Party, with nearly two-thirds of Republican voters in recent polls (e.g., 63% in a March 8-12, 2023 poll) indicating that Joe Biden did not legitimately win the 2020 election.
A Washington Post analysis, in turn, found that over half (51%) of Republican candidates in the 2022 election (291 in total) either denied or questioned the results of the 2020 election. An additional analysis—and the one that we employ here—by the PBS Newshour found that 28 Republican gubernatorial candidates publicly claimed either election fraud or that the election was stolen, or fueled doubts about the integrity of the election. Of these, half the candidates (14) lost their election. One of the nine candidates who outright denied the results of 2020 election (as opposed to those who fueled doubt about it) won their race (Kay Ivey in Alabama). Post-election analyses suggest that some of the outright denialism may have cost Republicans some victories (Malzahn and Hall 2023).16Regardless of how one interprets the 2022 results, the prevalence of election denial, and the willingness of many voters—primarily, but not exclusively Republicans—to vote for candidates who cast doubt on election integrity, raises concerns about the 2024 election, including the possibility of election-related violence (McLauchlin 2023). Our dependent variable for voting for an election denying/doubting candidate is coding 0 for no and 1 for yes (based on the PBS coding).
Figure 1 and Figure 2 Models
The figures come from generating predictive values from logit models, setting other variables to their mean values, using Clarify (King et al. 2000).
The model underlying the top panel of Figure 1 includes the following variables: Depression (.1218917 coefficient, .1105302 standard error, 0.270 p-value); COVID-19 conspiracy (2.7457, .1939097, 0.000); Democrat (.1184463, .199591, 0.553); Republican (1.724161, .1915634, 0.000); Independent (.4086037, .1902896, 0.032); Male (.0204614, .0734971, 0.781); Political interest (.2017607, .0489514, 0.000); Age (.004118, .002533, 0.104); Education (-.0797984, .0387573, 0.040); Income (-8.58e-07, 7.04e-07, 0.223); Ideology (.1781656, .0311746, 0.000); Election confidence (-1.062068, .0424215, 0.000); Black (-.2780494, .216158, 0.198); White (.2096096, .1879642, 0.265); Asian-Am. (.0769656, .2419056, 0.750); Hispanic (-.0781029, .2127658, 0.714); Vaccinated (-.1893769, .0310706, 0.000); Violence ever (.0567014, .1084222, 0.601); Violence now (.6568359, .137982, 0.000); COVID-19 discuss (.0994089, .0317399, 0.002); Follow politics (.0982094, .0596386, 0.100); Voted 2022 (.5027301, .1129106, 0.000); and Constant (-1.192587, .3192039, 0.000). Its log-likelihood is -3813.3568 and the N = 11,510.
The model underlying the bottom panel of Figure 1 includes the following variables: Depression (.0128725, .1271989, 0.919); COVID-19 conspiracy (2.590441, .2120431, 0.000); Depression X COVID-19 conspiracy (.8042038, .4520639, 0.075); Democrat (.1105281, .1996881, 0.580); Republican (1.713268, .191342, 0.000); Independent (.4024142, .1900532, 0.034); Male (.0193596, .0735592, 0.792); Political interest (.1989956, .0488947, 0.000); Age (.0039684, .0025349, 0.117); Education (-.081787, .0386692, 0.034); Income (-8.44e-07, 7.01e-07, 0.228); Ideology (.1804389, .0311419, 0.000); Election confidence (-1.063733, .0424242, 0.000); Black (-.285233, .2156439, 0.186); White (.2016584, .1872621, 0.282); Asian-Am. (.0711022, .2406737, 0.768); Hispanic (-.0757272, .2119273, 0.721); Vaccinated (-.1913471, .0310555, 0.000); Violence ever (.0534781, .10815, 0.621); Violence now (.6524175, .1376932, 0.000); COVID-19 discuss (.0977848, .0317888, 0.002); Follow politics (.0992385, .0595478, 0.096); Voted 2022 (.5026941, .1128549, 0.000); and Constant (-1.139944, .3197838, 0.000). Its log- likelihood is -3810.7157 and the N = 11,510.17The quantities of interest are not the coefficients themselves, but the first differences in predicted probabilities or expected values on the outcome variables (in this case, believing Trump won in 2020) as the key causal variables (here, depression and COVID-19 conspiracy beliefs) vary in combination (see Tomz et al. 2003: 19). This is what is displayed in the Figures, revealing clear significance.
The model underlying the top panel of Figure 2 includes the following variables: Depression (- .144263, 1262053, 0.253); COVID-19 conspiracy (.5995906, .2131255, 0.005); Democrat ( – 1.009283, .2058703, 0.000); Republican (2.321726, .1810139, 0.000); Independent (.525793, .1776517, 0.003); Male (.3461444, .0776506, 0.000); Political interest (.2127774, .0501988, 0.000); Age (.0135789, .0026627, 0.000); Education (-.0153723, .040441, 0.704); Income (1.15e-06, 7.19e-07, 0.109); Ideology (.4042893, .032315, 0.000); Election confidence (- .5001559, .043329, 0.000); Black (-.4646343, .2055725, 0.024); White (-.060855, .1747652, 0.728); Asian-Am. (.014826, .2376034, 0.950); Hispanic (-.2766618, .2058635, 0.179); Vaccinated (-.1243665, .0319214, 0.000); Violence ever (.0844056, .1241244, 0.496); Violence now (-.1388386, .1656633, 0.402); COVID-19 discuss (-.1110725, .0330426, 0.001); Follow politics (.0668687, .0619606, 0.280); Voted 2022 (1.432724, .1246389, 0.000); and Constant (- 4.141969, .306443, 0.000). Its log-likelihood is -3596.43 and the N = 11,517.
The model underlying the bottom panel of Figure 2 includes the following variables: Depression (-.3011212, .1460316, 0.039); COVID-19 conspiracy (.3896438, .2324582, 0.094); Depression X COVID-19 conspiracy (1.225567, .4770884, 0.010); Democrat (-1.017847, .2058622, 0.000); Republican (2.312831, .1806722, 0.000); Independent (.5187607, .1773184, 0.003); Male (.3463429, .0777376, 0.000); Political interest (.2113727, .0499713, 0.000); Age(.013479, .002669, 0.000); Education (-.0173004, .0404225, 0.669); Income (1.15e-06, 7.21e-07, 0.111); Ideology (.4071875, .0323549, 0.000); Election confidence (-.5036598, .0433293, 0.000); Black (-.4704429, .203545, 0.021); White (-.0685374, .1730701, 0.692); Asian-Am.(.0182181, .2362272, 0.939); Hispanic (-.2741457, .2043414, 0.180); Vaccinated (-.1279858, .0319227, 0.000); Violence ever (.0827487, .1243006, 0.506); Violence now (-.1522887, .1661311, 0.359); COVID-19 discuss (-.1136743, .0331137, 0.001); Follow politics (.0685077, .0618169, 0.268); Voted 2022 (1.434015, .1243487, 0.000); and Constant (-4.08667, .3056431, 0.000). Its log- likelihood is -3591.7205 and the N = 11,517.
Robustness Check Models
We ran several robustness checks. The first was to re-run the models regarding the belief that Trump won the 2020 election with all respondents instead of only respondents from states with deniers and doubts who are eligible. The main substantive take-away is unchanged.
The results are as follows for the model equivalent to that presented in the top panel of Figure 1 (without the interaction): Depression (.0965522, .0821192, 0.240); COVID-19 conspiracy (2.501817, .1496181, 0.000); Democrat (.1896565, .1426112, 0.184); Republican (1.721535, .1347787, 0.000); Independent (.4368872, .13356, 0.001); Male (.0297675, .0565171,0.598); Political interest (.2207015, .0378816, 0.000); Age (.0033041, .0019244, 0.086); Education (- .1291431, .0288719, 0.000); Income (-6.08e-07, 5.23e-07, 0.245); Ideology (.2124881, .0236134, 0.000); Election confidence (-1.067473, .0321073, 0.000); Black (-.0570892, .1660061, 0.731); White (.4318273, .142186, 0.002); Asian-Am. (.2521554, .1899685, 0.184); Hispanic (.0207758, .1634347, 0.899); Vaccinated (-.1733812, .0235144, 0.000); Violence ever (-.026116, .0856986, 0.761); Violence now (.7586753, .110265, 0.000); COVID-19 discuss (.0787065, .0245779, 0.001); Follow politics (.054869, .0467324, 0.240); Voted 2022 (.5136354, .0802853, 0.000); and Constant (-1.287967, .2305907, 0.000). Its log-likelihood is -6512.6028 and the N = 19,448.
The results are as follows for the model equivalent to that presented in the bottom panel Figure 1 (with the interaction): Depression (.0111404, .0943629, 0.906); COVID-19 conspiracy (2.361812, .1656972, 0.000); Depression X COVID-19 conspiracy (.6055636, .3480477, 0.082); Democrat (.1815525, .1427221, 0.203); Republican (1.714641, .1346773, 0.000); Independent (.4319043, .1335263, 0.001); Male (.0292581, .0565609, 0.605); Political interest (.2198751, .0378678, 0.000); Age (.0031424, .0019267, 0.103); Education (-.1309554, .0288194, 0.000); Income (-6.12e-07, 5.21e-07, 0.240); Ideology (.2125313, .0236093, 0.000); Election confidence (-1.070124, .0322139, 0.000); Black (-.0601316, .1656997, 0.717); White (.4268678, .1418496, 0.003); Asian-Am. (.2498052, .1892563, 0.187); Hispanic (.0200951, .1630526, 0.902); Vaccinated (-.1752644, .0235135, 0.000); Violence ever (-.0283851, .085465, 0.740); Violence now (.7517454, .1101749, 0.000); COVID-19 discuss (.078258, .0246058, 0.001); Follow politics (.0545213, .046687,0.243); Voted 2022 (.5174632, .0803219, 0.000); and Constant (- 1.236922, .2320824, 0.000). Its log-likelihood is -6509.731 and the N = 19,448.
Another robustness check was to re-run the models with voting for a denier or doubter and adding the belief that Trump won the 2020 election as an independent variable. The main substantive take-away is that the Trump won variable is highly significant but the central result regarding the depression X conspiracy beliefs interaction remains highly significant as well.
The results are as follows for the model equivalent to that presented in top panel of Figure 2 (without the interaction): Depression (-.1301683, .1267435, 0.304); COVID-19 conspiracy (.2759622, .2219403, 0.214); Democrat (-1.043029, .2067709, 0.000); Republican (2.162015, .1820783, 0.000); Independent (.4856972, .1780832, 0.006); Male (.349248, .078452, 0.000); Political interest (.1914111, .0504909, 0.000); Age (.0134234, .0026808, 0.000); Education (- .0119104, .0404816, 0.769); Income (1.33e-06, 6.98e-07, 0.057); Ideology (.3946302, .0324207, 0.000); Election confidence (-.3687516, .0467256, 0.000); Black (-.4042467, .2036287, 0.047); White (-.050743, .1733437, 0.770); Asian-Am. (.0360537, .2370336, 0.879); Hispanic (- .2486087, .2061553, 0.228); Vaccinated (-.1101747, .0320799, 0.001); Violence ever (.0812091, .1262611, 0.520); Violence now (-.2178979, .1680347, 0.195); COVID-19 discuss (-.1166404, .0332337, 0.000); Follow politics (.0511677, .0621087, 0.410); Voted 2022 (1.39511, .12562, 0.000); Trump won (.7177527 .0982093, 0.000); and Constant (-4.49728, .3054216, 0.000). Its log-likelihood is -3549.5925 and the N = 11,510.
Notably, here the COVID-19 conspiracy measure is no longer significant. This does not contradict any of our hypotheses; it reflects the Trump won in 2020 conspiracy as having more power in explaining voting for a denier / doubter (than the COVID-19 conspiracies). As we next show, our hypothesis regarding the severe depression interaction sustains.
The results are as follows for the model equivalent to that presented in bottom panel of Figure 2 (with the interaction): Depression (-.2749695, .147546, 0.062); COVID-19 conspiracy (.0840566, .2419085, 0.728); Depression X COVID-19 conspiracy (1.095313, .4690548, 0.020); Democrat (-1.04861, .2067636, 0.000); Republican (2.15509, .1818449, 0.000); Independent (.4802007, .1778666, 0.007); Male (.3487907, .0785369, 0.000); Political interest (.1898047, .0503291, 0.000); Age (.0133191, .0026868, 0.000); Education (-.0136084, .040503, 0.737); Income (1.32e-06, 7.01e-07, 0.059); Ideology (.3974723, .032474, 0.000); Election confidence (-.3727049, .046708, 0.000); Black (-.4099076, .2017425, 0.042); White (-.056436, .1717108, 0.742); Asian-Am. (.0393598, .235722, 0.867); Hispanic (-.2455156, .2047241, 0.230); Vaccinated (-.1137079, .0321036, 0.000); Violence ever (.0799807, .1264893, 0.527); Violence now (-.2299197, .1686107, 0.173); COVID-19 discuss (-.1192463, .0333246, 0.000); Follow politics (.053565, .0620099, 0.388); Voted 2022 (1.395618, .1254361, 0.000); Trump won (.7133198, .0983312, 0.000); and Constant (-4.44489, .3047612, 0.000). Its log-likelihood is – 3545.8019 and the N = 11,510.
Gender Models
To test Hypothesis 3, we ran each of the models underlying Figures 1 and 2 separately for men and women. The key result is that the interactions with depression are consistently significant (or very close to it) for men and not for women. This coheres with Hypothesis 3. We present all the models from the main paper by gender, for completeness. The results are as follows (with the probabilities reported in the paper coming from Clarify runs with these models).18The reported Ns are not the effective (weighted) Ns but rather the Ns from the unweighted raw data. The analyses were weighted though, as noted.
For men for the Trump won outcome without an interaction (akin to the top panel of Figure 1), the logit model results are: Depression (.1437528, .160985, 0.372); COVID-19 conspiracy (2.876749, .2762991, 0.000); Democrat (.2540129, .3366138, 0.450); Republican (1.641249, .3255882, 0.000); Independent (.4803315, .3245088, 0.139); Political interest (.172607, .0731376, 0.018); Age (.0055197, .0037079, 0.137); Education (-.0474129, .0563933, 0.400); Income (-9.57e-07, 1.22e-06, 0.431); Ideology (.1576641, .0467595, 0.001); Election confidence (-1.094727, .0599527, 0.000); Black (.0488113, .2998117, 0.871); White (.4486959, .2626973, 0.088); Asian-Am. (.2736865, .340929, 0.422); Hispanic (.1710009, .302859, 0.572); Vaccinated (-.1994376, .044204, 0.000); Violence ever (.0603954, .1465089, 0.680); Violence now (.7461726, .1834252, 0.000); COVID-19 discuss (.1372422, .0469587, 0.003); Follow politics (.1253586, .0896247, 0.162); Voted 2022 (.445668, .1711692, 0.009);and Constant (- 1.459657, .4916354, 0.003). Its log-likelihood is -2290.6745 and the N = 4,814.
For women for the Trump won outcome without an interaction (akin to the top panel of Figure 1), the logit model results are: Depression (.1063372, .1514346, 0.483); COVID-19 conspiracy (2.38997, .2585042, 0.000); Democrat (-.0780424, .2264222, 0.730); Republican (1.799828, .2133064, 0.000); Independent (.286844, .213115, 0.178); Political interest (.2408965,.0612788, 0.000); Age (.000719, .0033934, 0.832); Education (-.1264452, .0530822, 0.017); Income (-8.92e-07, 7.21e-07, 0.216); Ideology (.2168761, .0388639, 0.000); Election confidence (-1.025197, .0604715, 0.000); Black (-.6789406, .3206679, 0.034); White (-.1090185, .2799771, 0.697); Asian-Am. (-.1725399, .3566552, 0.629); Hispanic (-.3622022, .3082579, 0.240); Vaccinated (-.1868453, .0439765, 0.000); Violence ever (.1038333, .1447281, 0.473); Violence now (.3876029, .1979253, 0.050); COVID-19 discuss (.0446592, .0419936, 0.288); Follow politics (.0826139, .077745, 0.288); Voted 2022 (.5212381, .1414463, 0.000);and Constant (- .6860371, .4254662, 0.107). Its log-likelihood is -1867.8985 and the N = 6,696.
For men for the Trump won outcome with an interaction (akin to the bottom panel of Figure 1), the logit model results are: Depression (-.1063217, .1906316, 0.577); COVID-19 conspiracy (2.561397, .2982067, 0.000); Depression X COVID-19 conspiracy (1.704998, .6201896, 0.006); Democrat (.2386191, .3350022, 0.476); Republican (1.616418, .3231288, 0.000); Independent (.4617025, .3221042, 0.152); Political interest (.1637389, .0727331, 0.024); Age (.0052649, .0037139, 0.156); Education (-.0513863, .0560819, 0.360); Income (-9.27e-07, 1.21e-06, 0.442); Ideology (.1637383, .0468364, 0.000); Election confidence (-1.099911, .0599152, 0.000); Black (.0229567, .2958849, 0.938); White (.4201912, .2579799, 0.103); Asian-Am. (.240123, .3368198, 0.476); Hispanic (.1621929, .2977245, 0.586); Vaccinated (-.2045506, .0441367, 0.000); Violence ever (.0512486, .1454839, 0.725); Violence now (.744808, .1820879, 0.000); COVID-19 discuss (.132118, .0470155, 0.005); Follow politics (.1290939, .0890539, 0.147); Voted 2022 (.4480382, .1712086, 0.009); and Constant (-1.328383, .4893179, 0.007). Its log- likelihood is -2283.268 and the N = 4,814.
For women for the Trump won outcome with an interaction (akin to the bottom panel of Figure 1), the logit model results are: Depression (.1833799, .16962, 0.280); COVID-19 conspiracy (2.513636, .2871937, 0.000); Depression X COVID-19 conspiracy (-.6532001, .6079842, 0.283); Democrat (-.0706838, .2262532, 0.755); Republican (1.808124, .2129786, 0.000); Independent (.2892204, .2127239, 0.174); Political interest (.2401071, .0612177, 0.000); Age (.0008324, .0034015, 0.807); Education (-.1248585, .0530493, 0.019); Income (-9.03e-07, 7.24e-07, 0.212); Ideology (.2163318, .0388564, 0.000); Election confidence (-1.025192, .0604586, 0.000); Black (-.6803029, .3203495, 0.034); White (- .1101175, .2800389, 0.694); Asian-Am. (-.1797643, .3579381, 0.616); Hispanic (-.3705868, .3083629, 0.229); Vaccinated (-.1856919, .0438856, 0.000); Violence ever (.1023393, .1444311, 0.479); Violence now (.3994379, .197713, 0.043); COVID-19 discuss (.0448879, .0419179, 0.284); Follow politics (.0838732, .0778107, 0.281); Voted 2022 (.5227518, .1416189, 0.000); and Constant – (-.7140888, .4265816, 0.094). Its log-likelihood is -1867.152 and the N = 6,696.
For men for the voting for an election denier/doubter without an interaction (akin to the top panel of Figure 2), the logit model results are: Depression (.0885966, .1768657, 0.616); COVID-19 conspiracy (.471664, .2610026, 0.071); Democrat (-1.137151, .2903262, 0.000); Republican (2.21312, .261987, 0.000); Independent (.3339927, .2527552, 0.186); Political interest (.2166234, .0730535, 0.003); Age (.0175488, .0039375, 0.000); Education (-.0096963, .058414, 0.868); Income (1.84e-06, 9.82e-07, 0.062); Ideology (.3788641, .0453902, 0.000); Election confidence (-.5439077, .0641011, 0.000); Black (-.4512936, .2621777, 0.085); White (-.224136, .2220797, 0.313); Asian-Am. (-.0015572, .3171492, 0.996); Hispanic (-.4689495, .2669492, 0.079); Vaccinated (-.1836439, .046127, 0.000); Violence ever (.0445799, .1602321, 0.781); Violence now (-.0138477, .2079779, 0.947); COVID-19 discuss (-.1246171, .0477114, 0.009); Follow politics (.1528816, .0927967, 0.099); Voted 2022 (1.579456, .1874009, 0.000);and Constant (-3.72815, .4150623, 0.000). Its log-likelihood is -197.1628 and the N = 4,817.
For women for the voting for an election denier/doubter without an interaction (akin to the top panel of Figure 2), the logit model results are: Depression (-.4577538, .175497, 0.009); COVID- 19 conspiracy (.8198922, .3528475, 0.020); Democrat (-.7784841, .2749208, 0.005); Republican (2.56701, .2402788, 0.000); Independent (.8269838, .2396502, 0.001); Political interest (.2138478, .0670233, 0.001); Age (.0085877, .0035121, 0.014); Education (-.036684, .0547337, 0.503); Income (4.69e-07, 8.41e-07, 0.577); Ideology (.443588, .0441338, 0.000); Election confidence (-.4576056, .0569572, 0.000); Black (-.5063458, .3398409, 0.136); White (.1653161, .2942495, 0.574); Asian-Am. (.086615, .3743943, 0.817); Hispanic (.0324713, .3355358, 0.923); Vaccinated (-.0463292, .0414821, 0.264); Violence ever (.1936195, .1934378, 0.317); Violence now (-.4838015, .2795644, 0.084); COVID-19 discuss (-.0962829, .0433482, 0.026); Follow politics (-.0399066, .0804036, 0.620); Voted 2022 (1.271223, .1640474, 0.000); and Constant (-4.366707, .4723103, 0.000). Its log-likelihood is -1722.6559 and the N = 6,700.
For men for the voting for an election denier/doubter with an interaction (akin to the bottom panel of Figure 2), the logit model results are: Depression (-.1147638, .2094953, 0.584); COVID-19 conspiracy (.2049479, .2786547, 0.462); Depression X COVID-19 conspiracy (1.479125, .5838692, 0.011); Democrat (-1.155391, .289755, 0.000); Republican (2.199956, .2607492, 0.000); Independent (.3166507, .2516229, 0.208); Political interest (.2102441, .0726653, 0.004); Age (.0174442, .0039447, 0.000); Education (-.0140222, .0585152, 0.811); Income (1.83e-06, 9.84e-07, 0.063); Ideology (.3828621, .0452444, 0.000); Election confidence (-.5500547, .0641592, 0.000); Black (-.4679076,.2617411, 0.074); White (-.2396567, .2223136, 0.281); Asian-Am. (-.0066833, .3167502, 0.983); Hispanic (-.4687186, .2666214, 0.079); Vaccinated (-.1879124, .0462413, 0.000); Violence ever (.0378055, .1606824, 0.814); Violence now (-.0205388, .2083504, 0.921); COVID-19 discuss (-.1289026, .047933, 0.007); Follow politics (.1608035, .0927439, 0.083); Voted 2022 (1.584967, .1868725, 0.000); and Constant (- 3.639654, .4152396, 0.000). Its log-likelihood is -2192.4811 and the N = 4,817
For women for the voting for an election denier/doubter with an interaction (akin to the bottom panel of Figure 2), the logit model results are: Depression (-.5577417, .1940123, 0.004); COVID-19 conspiracy (.6865054, .3966552, 0.083); Depression X COVID-19 conspiracy (.8411239, .7995984, 0.293); Democrat (-.7802083, .2754458, 0.005); Republican (2.563169, .2404785, 0.000); Independent (.8291474, .2399355, 0.001); Political interest (.2163663, .0666411, 0.001); Age (.0085075, .0035239, 0.016); Education (-.0366938, .0547294, 0.503); Income (4.69e-07, 8.43e-07, 0.578); Ideology (.4454232, .0443944, 0.000); Election confidence (-.4585718, .0569617, 0.000); Black (-.5033382, .3352474, 0.133); White (.1644619, .2891882, 0.570); Asian-Am. (.0927419, .3702369, 0.802); Hispanic (.0356323, .3312385, 0.914); Vaccinated (-.0487355, .0413608, 0.239); Violence ever (.1979047, .1933647, 0.306); Violence now (-.5043088, .2801103, 0.072); COVID-19 discuss (-.0974231, .043446, 0.025); Follow politics (-.0423672, .0800623, 0.597); Voted 2022 (1.268294, .1637457, 0.000); and Constant (- 4.345189, .471617, 0.000). Its log-likelihood is -1721.724 and the N = 6,700
Question Wording
Trump Won 2020 Election
How much do you agree or disagree with the following statement: “If votes were fairly counted, Donald Trump would have won the 2020 election”?
Strongly agree (5)
Somewhat agree (4)
Neither agree nor disagree (3)
Somewhat disagree (2)
Strongly disagree (1)
2022 Gubernatorial Voting
Do you plan to vote in the 2022 election for Governor of [State]?
Yes, I already voted (1)
Yes, I plan to vote (2)
No, I do not plan to vote (3)
No, I am voting in another state (4)
No, I am not eligible to vote (5)
Which candidate for Governor from [State] do you support?
–Response options included every candidate in the respondent’s state (including the options “another candidate” and “I do not support any candidate.” Thus, there were 36 unique versions of this for each state with a gubernatorial election. The following is an example from Alabama.
Which candidate for Governor from Alabama do you support?
Kay Ivey (Republican) (1)
Yolanda Flowers (Democrat) (2)
James Blake (Libertarian) (3)
Jared Budlong (Independent) (4)
Another candidate (99)
I do not support any candidate (100)
–These were re-coded so that 0 = did not vote for an election denier/doubter; 1 = voted for an election denier/doubter, per the PBS designations.
COVID-19 Vaccine Conspiracy Beliefs
Below are some statements about the COVID-19 vaccines that are currently being distributed. To the best of your knowledge, are those statements accurate or inaccurate?
1. The COVID-19 vaccines will alter people’s DNA.
2. The COVID-19 vaccines contain microchips that could track people.
3. The COVID-19 vaccines contain the lung tissue of aborted fetuses.
4. The COVID-19 vaccines can cause infertility, making it more difficult to get pregnant.
5. The COVID-19 vaccines contain a bioluminescent marker used to trace people
–Respondents were given one point for each false claim they classified as accurate. The answers were then summed and normalized to a 0-1 interval, where 0 indicates that the respondent did not believe any of the false claims and 1 indicates that a respondent believed all five false claims were accurate.
Depressive Symptoms
Over the last two weeks, how often have you been bothered by the following problems?
− Little interest or pleasure in doing things
− Feeling down, depressed, or hopeless
− Trouble falling or staying asleep, or sleeping too much
− Feeling tired or having little energy
− Poor appetite or overeating
− Feeling bad about yourself – or that you are a failure or have let yourself or your family
down
− Trouble concentrating on things, such as reading the newspaper or watching television
− Moving or speaking so slowly that other people could have noticed — or so fidgety or
restless that you have been moving a lot more than usual
− Thoughts that you would be better off dead, or thoughts of hurting yourself in some way
- Not at all (0)
- Several days (1)
- More than half the days (2)
- Nearly every day (3)
Demographic Variables
Raw household income as provided by vendor.
–Numeric value
Gender as provided by vendor (M/F only)
Female = Female
Male = Male
Race as provided by vendor (select one, 5 categories)
African American
Asian American
Hispanic
White Other
Education level
Some High School or Less(1)
High School Graduate (2)
Some College (3)
College Degree (4)
Graduate Degree (5)
What is your current age?
Political Variables
Generally speaking, do you think of yourself as a…
Republican (1)
Democrat (2)
Independent (3)
Other (4)
In general, do you think of yourself as…
Extremely liberal (1)
Liberal (2)
Slightly liberal (3)
Moderate, middle of the road (4)
Slightly conservative (5)
Conservative (6)
Extremely conservative (7)
In general, how interested are you in US politics and government?
Extremely interested (5)
Very interested (4)
Somewhat interested (3)
Not very interested (2)
Not at all interested (1)
How closely do you follow news and information about politics and current affairs?
Very closely (4)
Somewhat closely (3)
Not very closely (2)
Not closely at all (1)
How confident are you in the fairness of the 2020 presidential election?
Very confident (4)
Mostly confident (3)
Not very confident (2)
Not at all confident (1)
Is it justifiable to engage in violent protest against the government right now?
Definitely yes (1)
Probably yes (2)
Probably not (3)
Definitely not (4)
Is it ever justifiable to engage in violent protest against the government?
Definitely yes (1)
Probably yes (2)
Probably not (3)
Definitely no (4)
The voting in 2022 in the state variable requires an affirmative answer (voted or plan to vote) to one of the following three questions.
Do you plan to vote in the 2022 election for Senate in [State]?
Yes, I already voted (1)
Yes, I plan to vote (2)
No, I do not plan to vote (3)
No, I am voting in another state (4)
No, I am not eligible to vote (5)
Do you plan to vote in the 2022 election for Governor of[State]?
Yes, I already voted (1)
Yes, I plan to vote (2)
No, I do not plan to vote (3)
No, I am voting in another state (4)
No, I am not eligible to vote (5)
Do you plan to vote in the 2022 election for the House of Representatives?
Yes, I already voted (1)
Yes, I plan to vote (2)
No, I do not plan to vote (3)
No, I am not eligible to vote (4)
COVID-19 Variables
Have you received a COVID-19 vaccine?
No (1)
Yes, one dose (2)
Yes, two doses (3)
Yes, three doses (4)
Yes, four or more doses (5)
How often do you talk to people about COVID-19, either in person, over the phone, or electronically?
A few times a day (6)
Daily (5)
A few times a week (4)
Once a week (3)
Less than once a week (2)
Never (1)
Supporting Information References
Annenberg IOD Collaborative. 2023. Democracy Amid Crises: Polarization, Pandemic, Protests, and Persuasion. New York: Oxford University Press.
Commission on Presidential Debates. 2020. “September 29, 2020 Debate Transcript.” Available online at: https://bit.ly/36wjTuI.
Enns, Peter K., and Jake Rothschild. 2021. “Revisiting the ‘Gold Standard’ of Polling.” 3Streams, April 12, 2021.
King, Gary, Michael Tomz, and Jason Wittenberg. 2000. “Making the Most of Statistical Analyses.” American Journal of Political Science 44: 347–61.
Lehdonvirta, Vili, Atte Oksanen, Pekka Räsänen, and Grant Blank. 2021. “Social Media, Web, and Panel Surveys.” Policy & Internet 13: 134–55.
Malzahn, Janet, and Andrew B. Hall. Election-Denying Republican Candidates Underperformed in the 2022 Midterms. No. 4076. 2023.
McLauchlin, Théodore. “Tail Risks for 2024: Prospects for a Violent Constitutional Crisis in the United States.” Policy 28 (2023).
Radford, Jason, Jon Green, Alexi Quintana, Alauna Safapour, Matthew Simonson, Matthew Baum, David Lazer, et al. 2020. “Validating the COVID States Method.” The COVID States Project. https://osf.io/qxez5/.
Tomz, Michael, Jason Wittenberg Gary King. 2003. “Clarify: Software for Interpreting and Presenting Statistical Results.” http://www.gvptsites.umd.edu/uslaner/clarify.pdf.