
Center News
Announcing the winner of the 2026 Goldsmith Prize for Explanatory Reporting
![]()
Journalism, Media Business Models, Media Creation, Media Standards & Practices

Mike Beaudet is a professor of the practice at Northeastern University School of Journalism and an investigative reporter at WCVB- TV Boston. Contact: m.beaudet@northeastern.edu
John Wihbey is an associate professor of journalism and media innovation at Northeastern, a faculty affiliate at Northeastern’s Ethics Institute, and a former Research Associate and Assistant Director at the Shorenstein Center.
Anna Campbell is a master’s candidate and a Video Innovation Scholar at Northeastern University’s College of Arts, Media, and Design.
Working paper co-published by the Shorenstein Center on Media, Politics and Public Policy at the Harvard Kennedy School and Northeastern University’s School of Journalism. This research was supported by the Stanton Foundation.
Read and download a PDF version of this paper here.
Local news is rapidly disappearing across parts of the country, with media ownership consolidation and the number of shuttered newspapers continuing to rise. There is a pressing need for television news to step into the void by elevating the quality of its product and enriching local civic and political ecosystems with compelling, factual coverage. To do this, local TV news must catch up with the tremendous cultural shifts in media consumption, meeting new audience expectations, preferences, and needs for information delivery and engagement. This report makes the case that using innovative animation and graphics techniques in storytelling can meaningfully modernize the news product, attract new audiences, and help journalists grapple with and explain problems and solutions in an increasingly complex society. The findings in this report come from experimental engagement with two leading local TV news stations and their respective audience markets in the greater Chicago and Boston areas. This report represents the culmination of four years of on-the-ground research with the local TV news industry, and it is the second in a two-part series for the Shorenstein Center.
The need to improve the quality and reach of local television news in the United States has seldom been greater. As the local newspaper industry has dramatically contracted and communities across the United States now see little to no local print-based coverage, it is falling to many broadcasters to help keep communities informed and aware of the issues confronting them.1
The state of the local TV news industry is, relatively speaking, still strong in many markets. Despite structural challenges and predictions of its demise, the local TV industry writ large continues to show surprising durability in terms of viewership, revenue, and newsroom headcount.2 Of course, worries about ownership changes and partisanship cannot be ignored over the long run; nor can corresponding shifts in the types of stories that are covered, particularly in the political domain.3
The COVID-19 pandemic has again made the importance of timely, evidence-based, and compelling coverage clear to the public, policymakers, and journalists themselves, and local TV has played a vital role in helping many communities respond to the rapidly evolving situation. Even so, local TV news continues to face a number of challenges in communicating clear and accurate information on public health-related stories.4 The complex pandemic story—with data, science, and expertise front-and-center―has not been an easy subject for local broadcasters, indeed all news media, to understand and unpack for audiences. Having sufficient newsroom resources and experienced journalists are crucial factors in covering such stories effectively, but there are many actions news stations can take to improve their public health coverage.5
For the past several years, our research group at Northeastern University’s School of Journalism has been studying the use of animation—graphical tools that open up whole new possibilities for video storytelling—in the local TV news ecosystem as a way of addressing two key challenges: 1) Attracting younger audiences, whose tastes and sensibilities are different than those of older news consumers; and 2) Grappling with the increasing complexity of policy issues that journalists must try to explain to the public, such as climate change, social justice, and public health.
Our 2019 report for the Shorenstein Center on Media, Politics and Public Policy, “Innovative Storytelling Practices to Engage New Audiences,” provided evidence that the strategic use of animation in local broadcasting could help engage younger audiences; these storytelling tools proved particularly effective on hard news stories. These findings were drawn from experimental testing of videos―some traditional, some with animation―with a national survey panel (N=613; average age 34) across six diverse media markets.
Reinventing Local TV News Research Summary Video
Click here to read an accessible transcript of the “Reinventing Local TV News 2021” video.
Our 2019 report for the Shorenstein Center on Media, Politics and Public Policy, “Innovative Storytelling Practices to Engage New Audiences,” provided evidence that the strategic use of animation in local broadcasting could help engage younger audiences; these storytelling tools proved particularly effective on hard news stories.6 These findings were drawn from experimental testing of videos –– some traditional, some with animation –– with a national survey panel (N=613; average age 34) across six diverse media markets.7
The current study follows up on this pilot research and presents wider evidence based on both expanded survey data (N=1,015, across 18-54 age demographics in two metro markets) and real-world engagement in the newsrooms of two large-market stations, WLS-TV Chicago and WCVB-TV Boston where our project funded and embedded animators. These stations agreed to partner with our research group to create two new Visual Content Producer (VCP) roles; these one-year positions were funded by the Stanton Foundation, which supported both phases of our research. Two recent graduates with backgrounds in animation took on this experimental role. They worked with reporters, producers, photographers, and editors to leverage innovative animation-focused storytelling techniques within the fast-paced context of these large U.S. newsrooms. Importantly, we were able to re-use the content that was produced through these partnerships to create realistic testing materials, which we then presented to audiences in a controlled experimental setting.
Here we present findings from Part II of our research project. The clear story that emerges both from the expanded survey research and the industry-embedded work is that animation can make a significant difference on a number of measures, and that stations that invest in video innovation in this regard stand a better chance of succeeding in the marketplace by: (1) increasing viewer comprehension, (2) making the news product more attractive, (3) reaching new audiences, (4) optimizing for a web-based experience, and (5) increasing ratings.
Building on knowledge from the first phase of our research project, we decided to design a larger set of experiments that could attempt to isolate the effects of animation and measure its efficacy across a variety of dimensions. Ideally, of course, stations might try to randomize and experiment with different kinds of segments and study ratings and online data to determine these effects. Given the complexity of such real-world experimentation, we ultimately decided to use real stories that had run on the stations previously, but test them in controlled online experiments.
We surveyed a total of 1,015 adults ages 18-54 across two large urban news markets: the greater Chicago and Boston areas, respectively, the home bases of our station partners. Surveys were conducted in January 2021. The samples were stratified to match the underlying demographics of these markets in terms of age, gender, and race. The firm SmithGeiger facilitated the online survey research. The overall sample was 56% female, 44% male; 31% of respondents were ages 18-34, while the rest were ages 35-54; 74% of respondents were white, 12% Black, 9% Latino, and 8% Asian-American. About half of all respondents were weekly local TV news viewers.8
Our survey first gathered general responses about news consumption, device use, and storytelling expectations, and then proceeded to A/B test a series of real news segments with and without enhanced animation and graphical elements, randomizing which versions were seen first to control for novelty or fatigue. The stories tested here incorporated the animation work of the VCPs embedded at our partner stations, WLS-TV in Chicago and WCVB-TV in Boston. Some had included animated segments at the time they were aired; others were enhanced with animation in post-production. Each “animated” story had a “conventional” counterpart, an alternate version of the segment that told the same story using video only.
The goal was to aggregate data across the Chicago and Boston markets by showing respondents a mix of six distinct news stories (two versions per story) for a total of 12 different story executions. Each respondent saw four videos, all drawn from his/her market. Half of the videos were conventional; half were animated. For the first two video exposures the same news story was seen twice: half saw the animated version first; half saw the conventional version first. The final video appeared in a social media frame (a Facebook-like interface).
The stories chosen aimed to capture a wide variety of news topics, from investigative stories to political explainers to COVID-19 developments. All stories were locally focused, and many had a quantitative or spatial component that we hypothesized animation would help clarify. In Chicago, the stories involved a plane crash, a COVID-19 super-spreader event, and an investigative story about police stops. In Boston, the stories involved contact tracing issues, policy disputes over taxes, and an investigative story about lobbying in Massachusetts.
Below is an example of each, on the same story:
WLS Conventional Video
Click here to read an accessible transcript of the “WLS Non Animated Police Stops” video.
WLS Animated Video
Click here to read an accessible transcript of the “WLS Animated Police Stops” video.
WCVB Conventional Video
Click here to read an accessible transcript of the “WCVB Non Animated Contact Tracing” video.
WCVB Animated Video
Click here to read an accessible transcript of the “WCVB Animated Contact Tracing” video.
We measured audience responses including whether respondents had a positive initial impression of the video, said they would be likely to share or discuss the story with others, or tune back in to a station that regularly provided similar coverage. We also tested comprehension of specific items illustrated by graphics in the animated versions of the stories with a multiple-choice questionnaire.
At significant levels, viewers in our sample preferred the animated approach. From the vast array of data we gathered on specific story responses and shifting attitudes toward local television news in general, we can glean the following takeaways:
I. Stories incorporating animation are more satisfying.
Animated versions of the stories were preferred to their conventional counterparts by a 24% margin overall. These stories were more appealing, clear, compelling, and memorable. Specific descriptors where animation won out included “well crafted,” “visually interesting,” “innovative,” and “direct and to the point.” Across all stories shown, the animated stories beat the conventional stories by at least a small margin in percentage of respondents who said that they held a “very favorable” opinion of the segment.
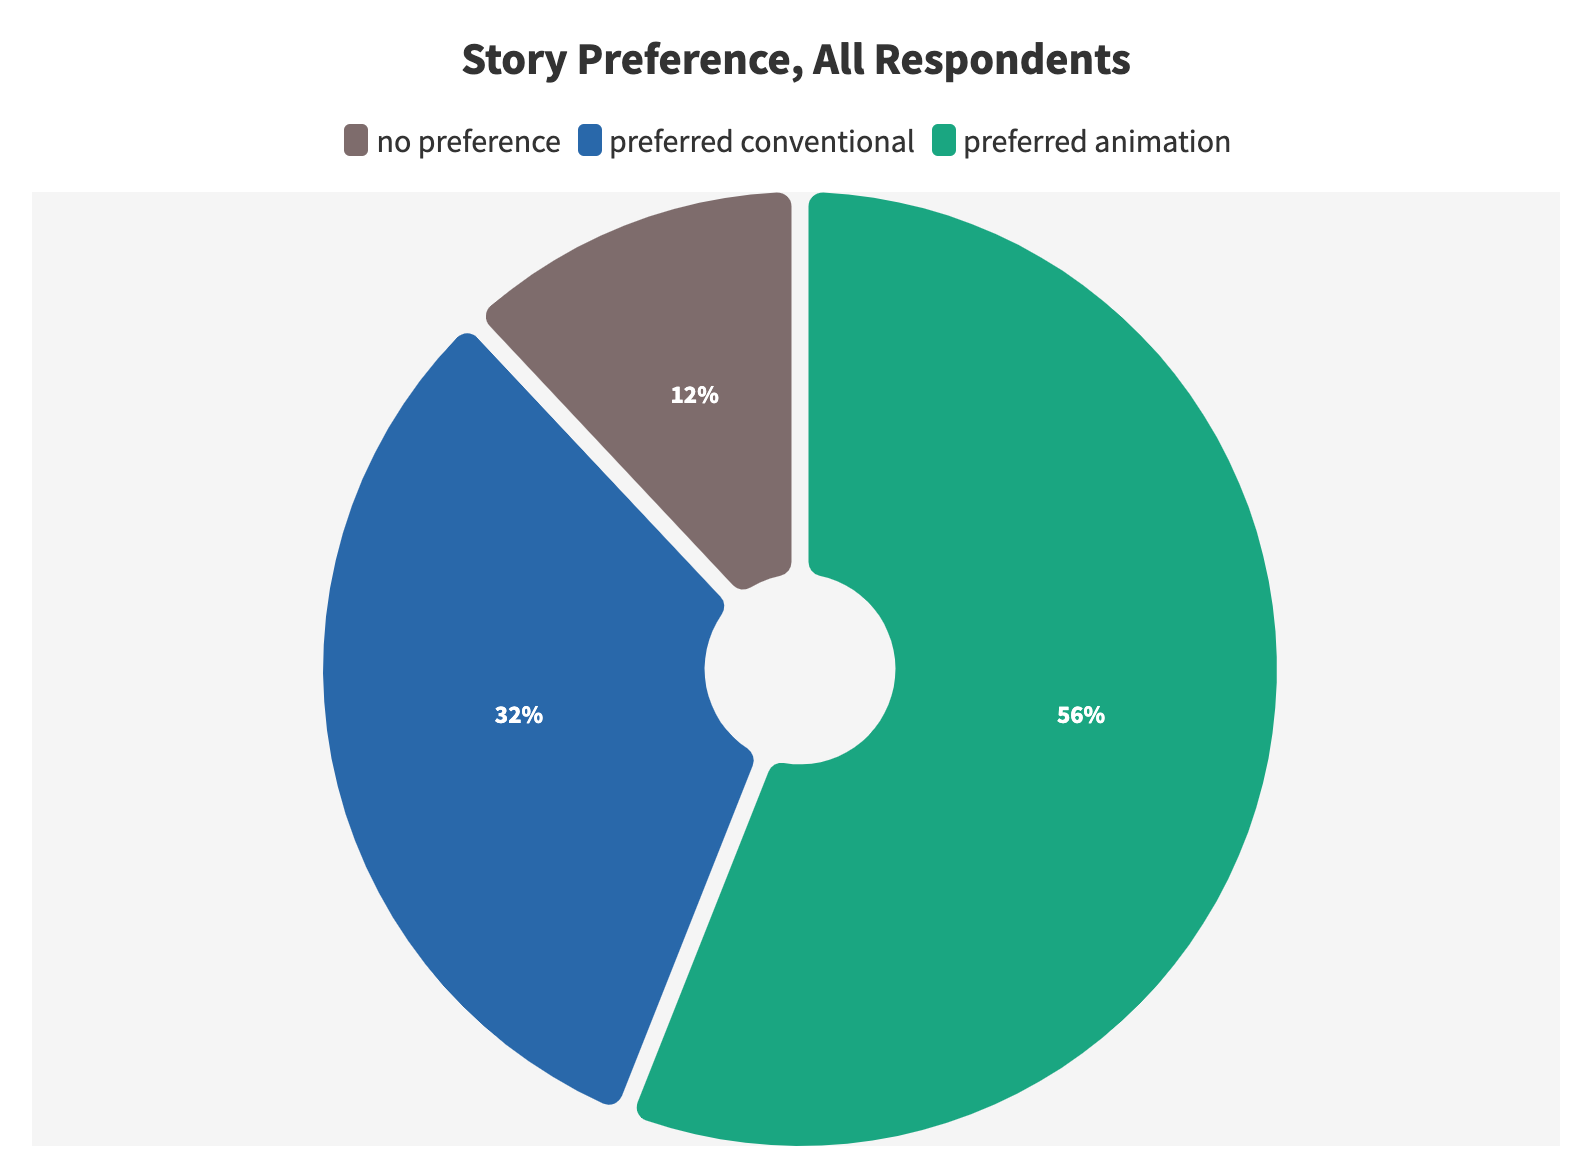
Respondents preferred the animated versions of the stories by a 24% margin in total.
Viewers also approved of the amount of information included in the animated stories and generally ranked the animated stories as more interesting to watch. Animation makes stories feel more relevant in content––amongst the group who saw the animated version first, 20% more viewers agreed that that version of the story captured and focused on what mattered to them––and resonant in tone, a likely driver of future viewing behavior.
Animation also captured positive descriptions in the open-ended questions posed in our survey. In our open-ended section, viewers also praised animation more generally, expressing that advanced graphics “[make] it easier to understand the story,” “break up the story,” “makes [the story] very interesting and entertaining to watch,” and “helps to reinforce important points in a story.”
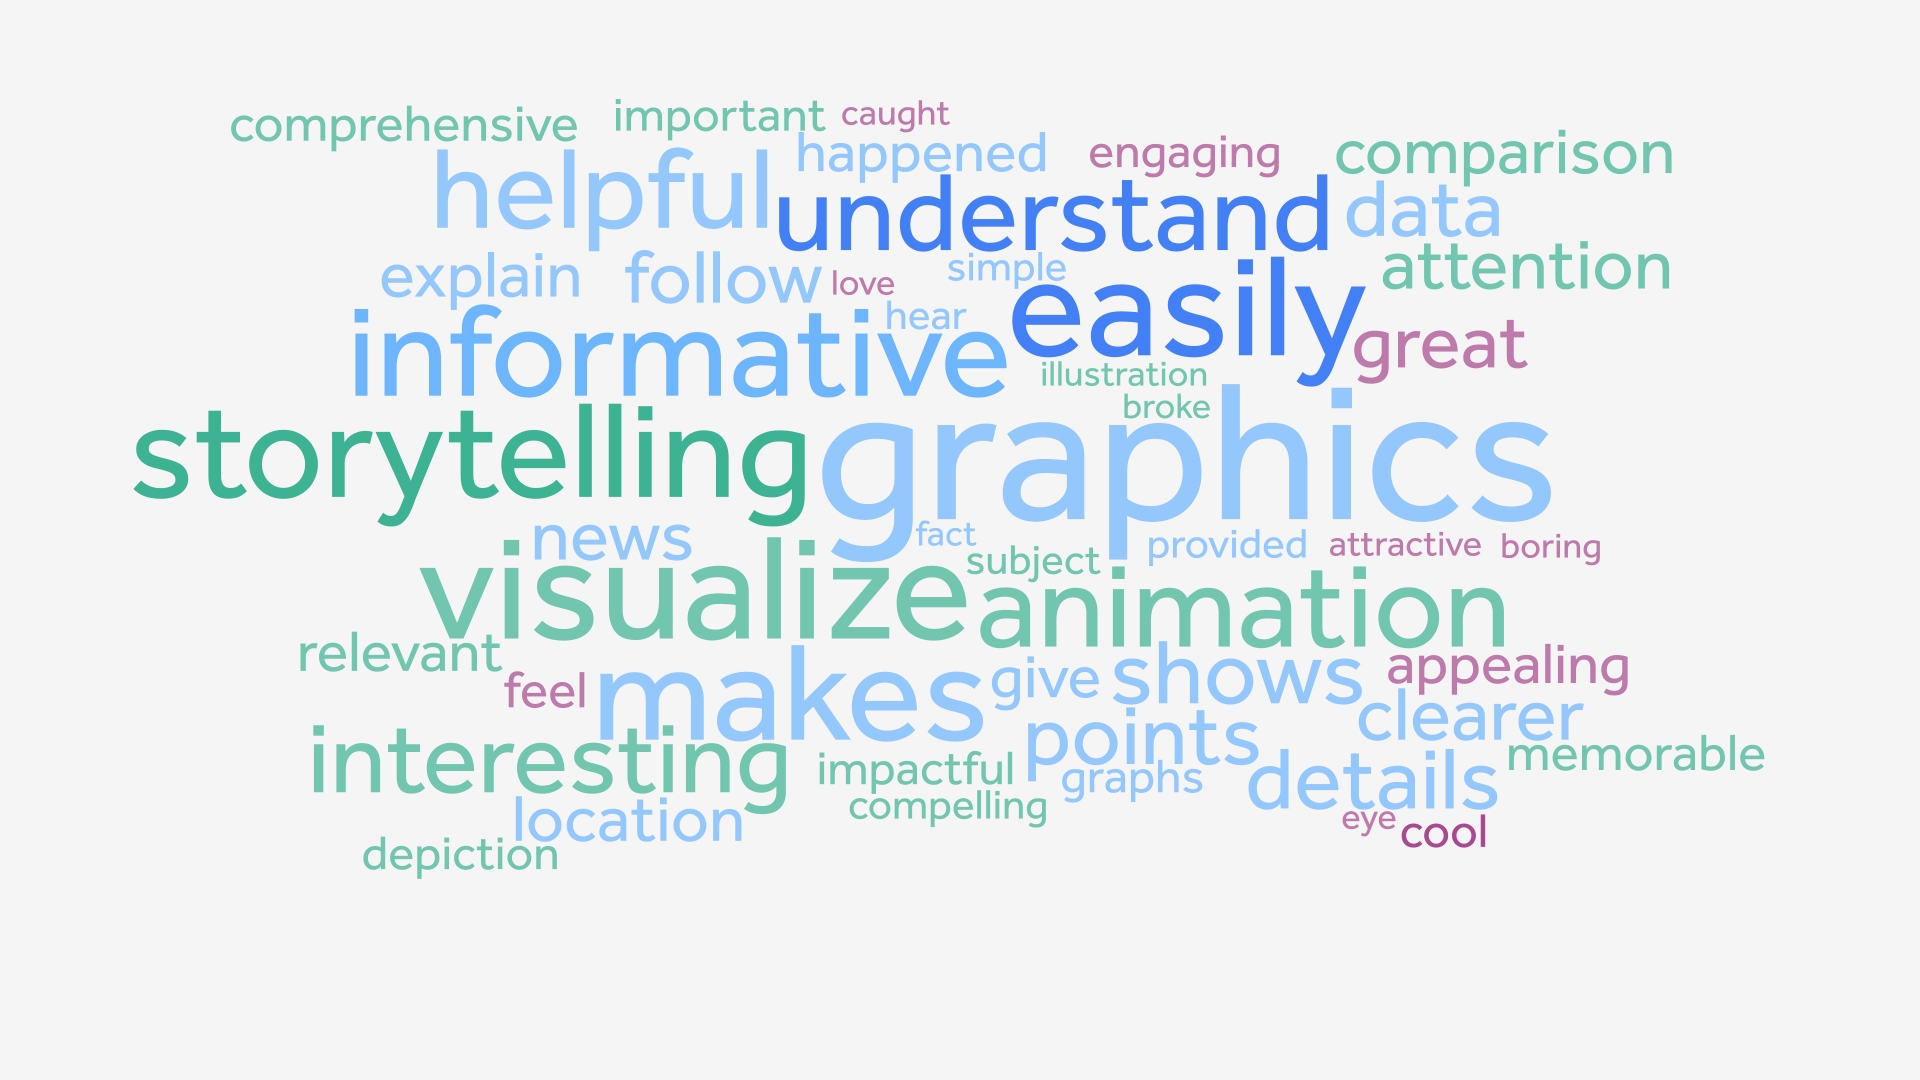 Audiences frequently used similar keywords in open-ended responses about why the animated version was preferred.
II. Informative graphic sequences help audiences make sense of the facts.
Animation consistently helped viewers absorb information more efficiently, both by their own estimation and as evidenced by quantitative retention tests.
Videos enhanced with maps, graphs and charts, and visual timelines helped our viewers feel that they were being delivered the right amount of information, as opposed to being overwhelmed with detail or left with questions at the end.
When asked whether these quantitative elements––location, proportions, and timelines––were clearly depicted in the story they’d just seen, viewers of the animated stories were at least 10% more likely to answer affirmatively. As one viewer put it, the animated version of a story about a super-spreader event in Chicago “more clearly showed how many people [were] infected” with the coronavirus. A story about a small plane crashing off the freeway was described as “easy to follow” and “familiar” when maps and text-based graphics showing the location and time of the incident were added.
Timelines and maps in the animated videos saw a roughly 10% increase in perceived “helpfulness” of explaining events after seeing the animated approaches in our sample.
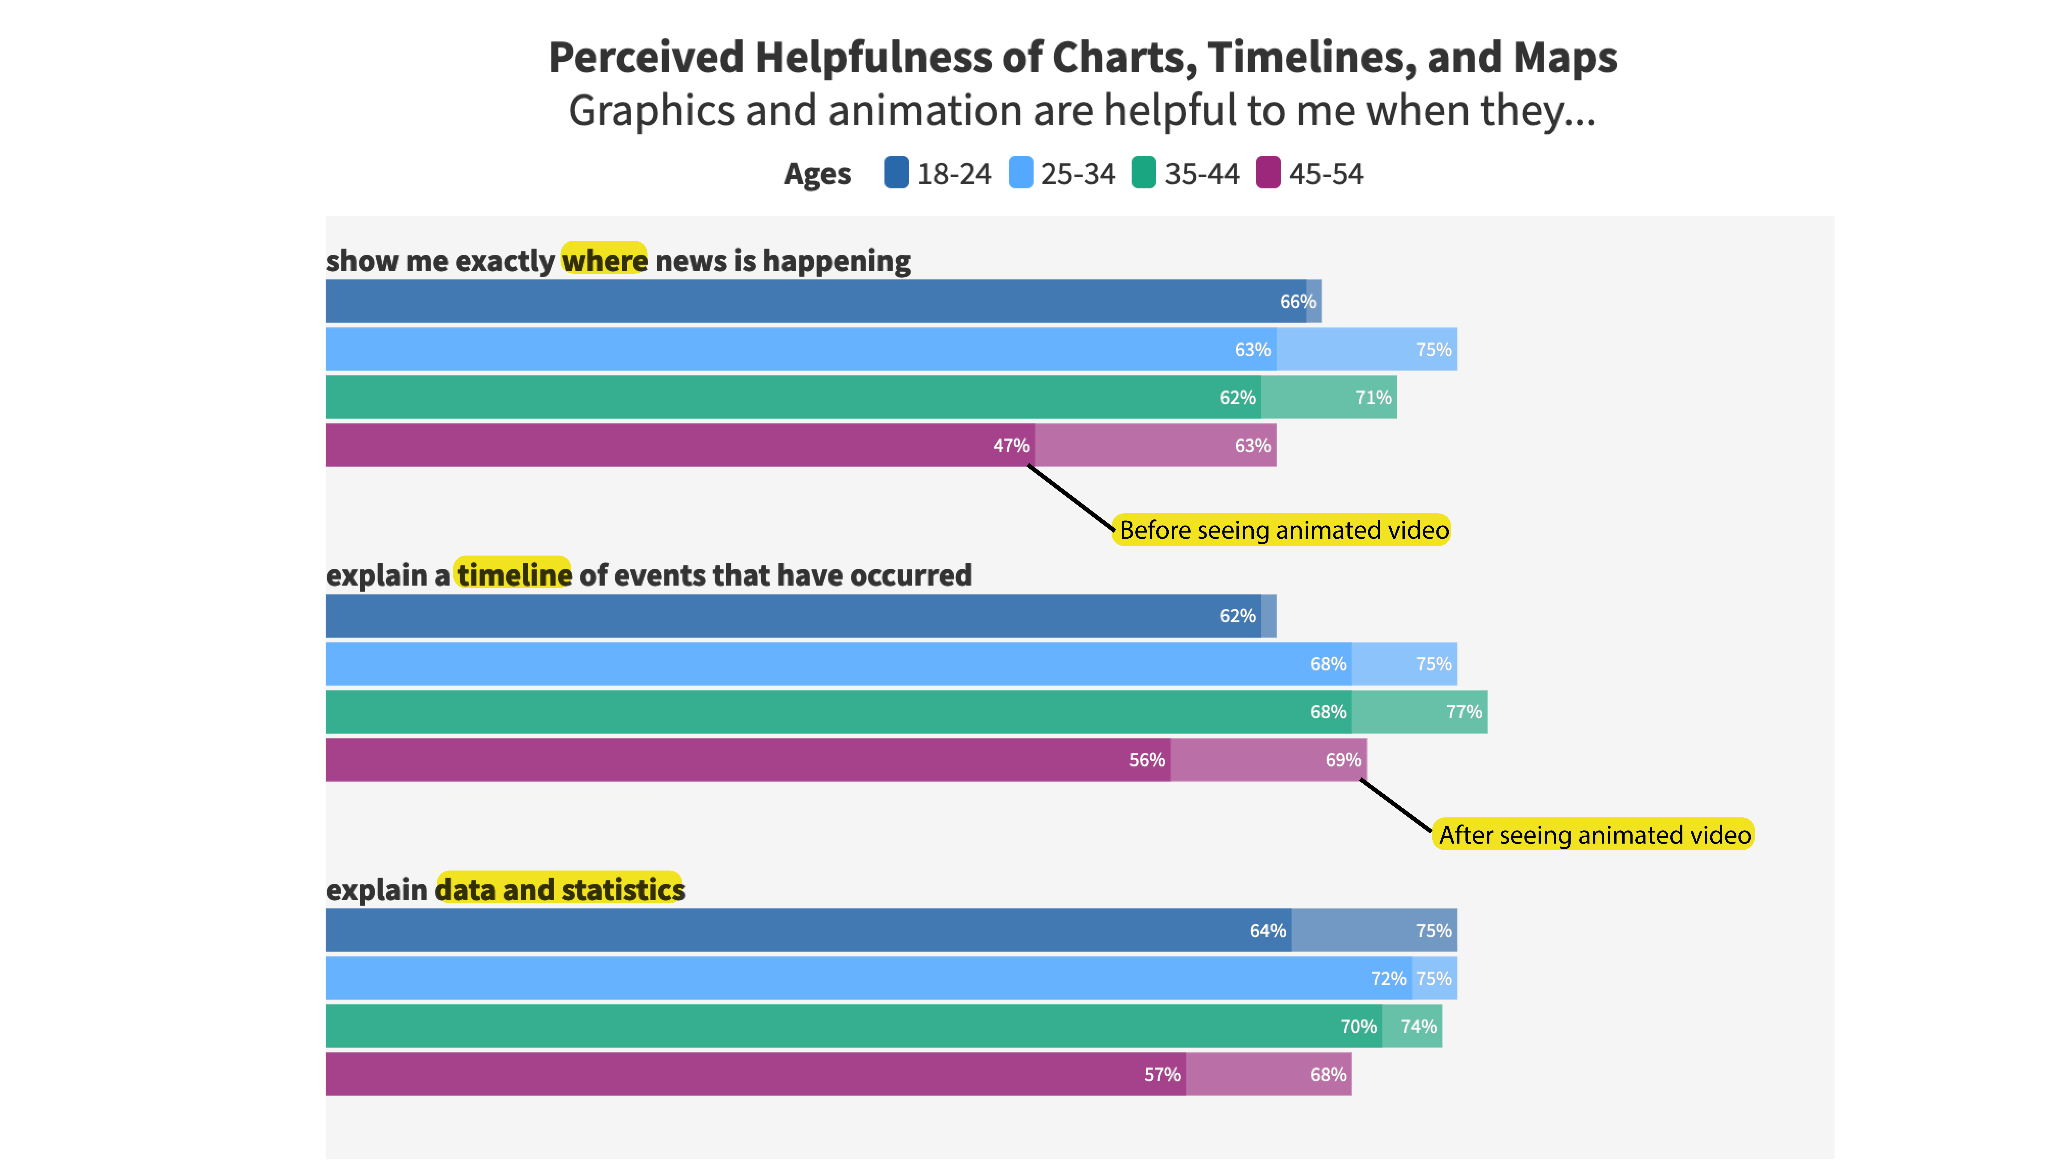
Charts, timelines, and maps are helpful to viewers across demographics
Beyond self-reported impressions, however, viewers’ actual comprehension and memory of specific items mentioned in the story was quizzed as well. Maps, charts, and motion graphics sequences emphasizing timelines did in fact consistently increase the amount and accuracy of specific facts with which viewers came away.
We also observed some interesting demographic trends when narrowing our results to those videos that included animated statistical comparisons, maps, and timelines. Charts and visual statistics were most helpful to the 18-24 year olds; maps were most helpful to the 25-34 year olds, and visual timelines were most helpful to the 35-44 year olds. Interestingly, the biggest jump in perceived “helpfulness” after viewing each infographic example was observed among the 45-54 year old demographic, suggesting that while this group’s expectations for broadcast graphics are initially quite low, they may be the most impressed with the value added.
Infographics helped bolster trust, as well, with visual statistics and maps significantly increasing the amount that 35-54 year-olds trusted the content of a broadcast.
III. Graphically rich stories can surface new preferences and attract new audiences while exceeding the expectations of a core viewer base.
Animation was, in some cases, a hidden preference surfaced by our inquiry. Prior to viewing the videos in our sample, only 50% of 18-24 year olds said they liked to see animation and graphics in local news stories; that number jumped to 70% after seeing these new possibilities. Amongst the 45-54 demographic, the number of respondents who expressed a preference for graphics and animation in local news crossed the halfway mark from 41% to 54% after exposure to our animated video examples.
Female viewers in general recognized the untapped potential of graphics, with a 17% increase in the number of responses favoring animation as a regular part of a broadcast. Younger women were generally less satisfied with the status quo for aesthetics and innovation in broadcast news, and while older women were initially most skeptical about the power of graphics, they too were won over by the approach by a large margin.
African American viewers seemed to especially appreciate charts and infographics; this group expressed an affinity for graphics and animation that grew by 21% after seeing the experimental videos. While only 57% of these viewers initially ranked visual statistics and timelines as helpful storytelling tools, that number surged to 75% after seeing the possibilities presented by the videos.
Hispanic viewers, and viewers of all ethnicities in an income bracket above $100,000 annually, also indicated that they would be more likely to watch local news in general if it offered detailed graphics and animation routinely, by a significant 18% margin.
Animation was cited as a reason for watching the local news more often by eight points among high affinity “Core Loyalists,” or those especially habituated to one particular station, while for new viewers with five years or fewer in their respective market, seeing our videos increased the perception of the power of graphics to explain a story’s impact on them personally by 10%.
IV. Enhancing broadcasts with animation and graphics may have a significant effect on viewer behavior after watching the broadcast.
Key insights from the survey data regarding subsequent intention and potential behavior can be broken down into three categories:
Favorability
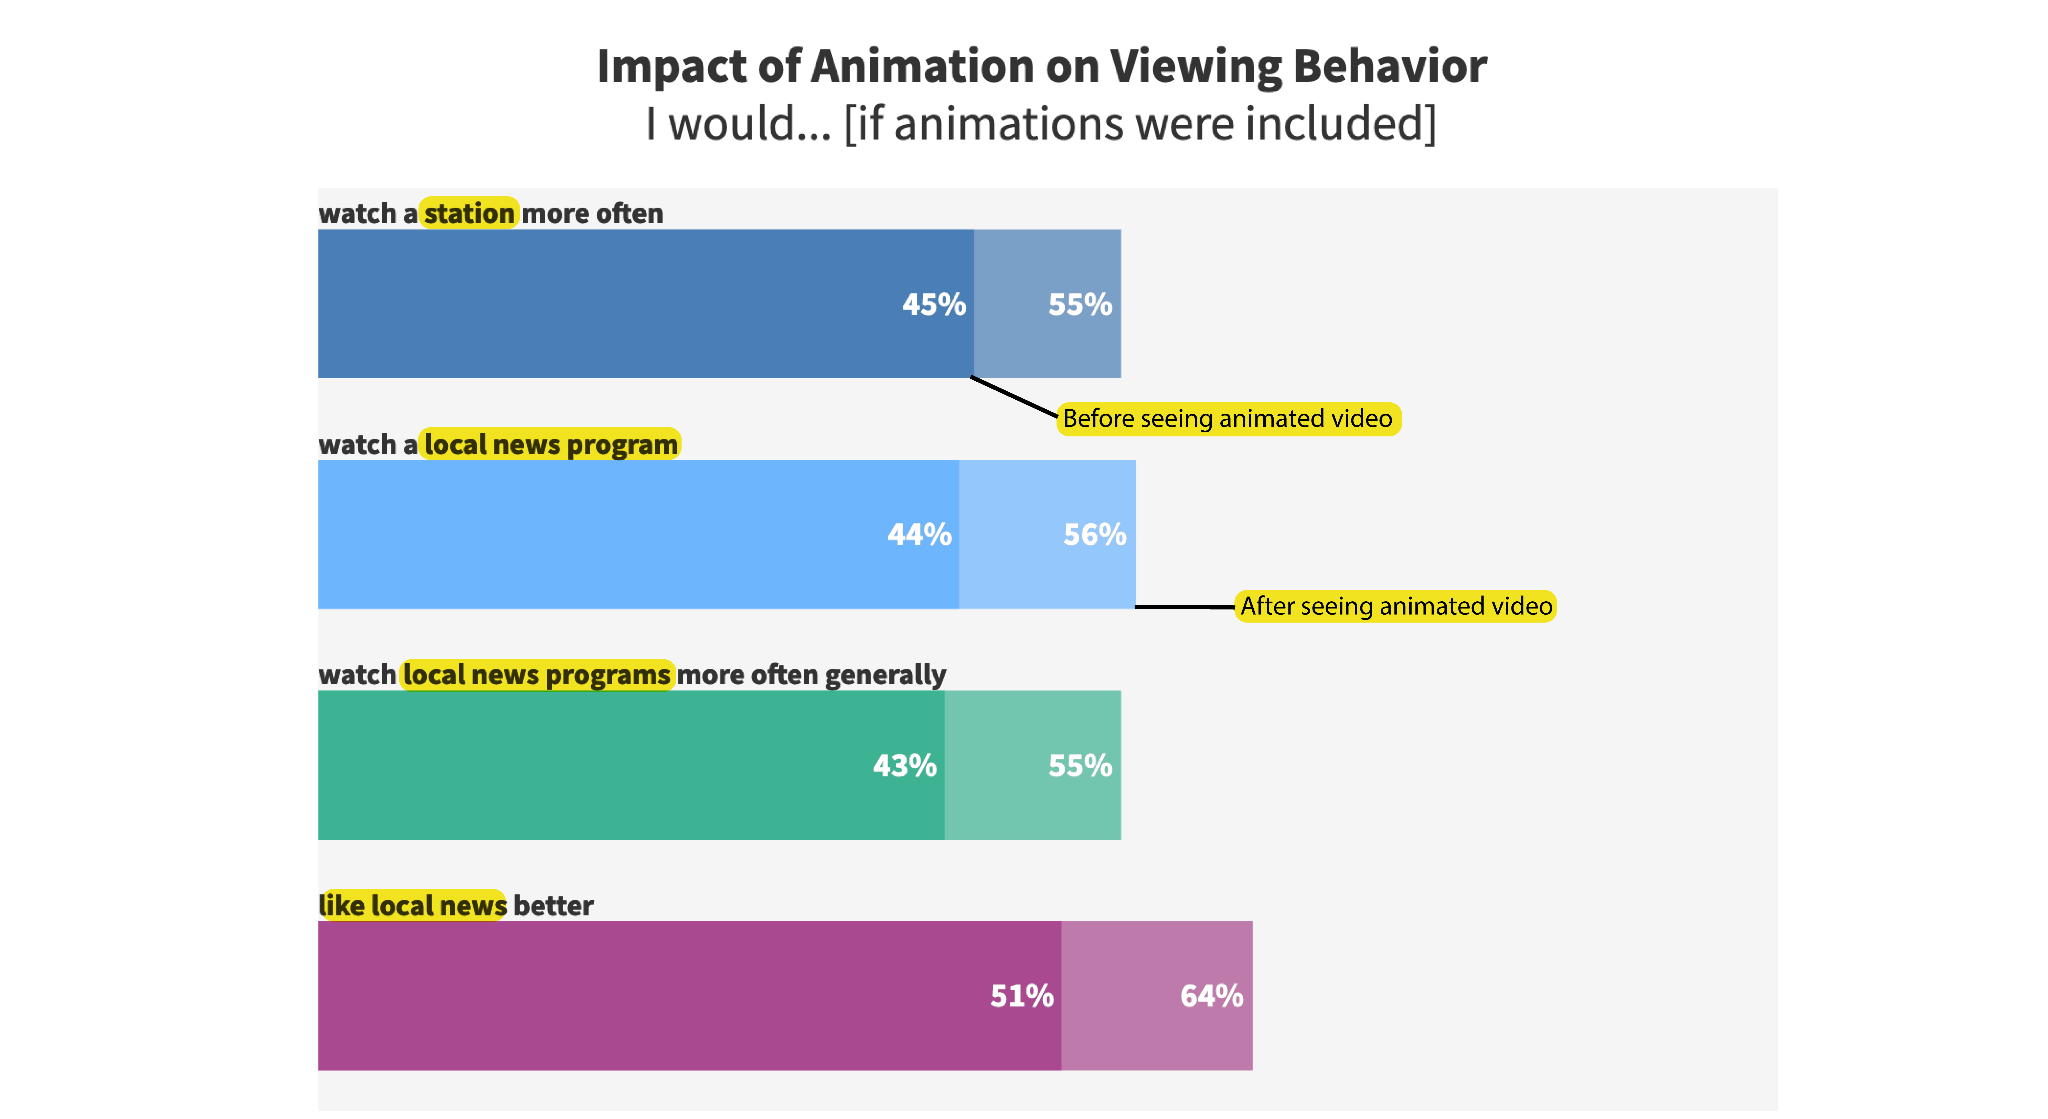
At a birds-eye level, animation helped consumers substantially shift their views on local news as a whole. Watching our VCPs’ animated stories significantly increased the rates at which viewers reported being inclined to watch a particular program, a station, or local news programs more generally if the quality or quantity of graphics was improved. In fact, after seeing the possibilities afforded by advanced animation and graphics, news consumers become less satisfied with the more conventional way of delivering news stories.
Seeing the animation examples in our study increased the likelihood our viewers said they’d come back for more.
Shareability
Graphically sleek stories are more shareable. Viewing the animated video version consistently increased participants’ self-reported willingness to share on social media or discuss a news item with someone they know.
Station Loyalty
Viewers are more likely to watch a station with improved graphics. In fact, our survey results suggest that the effective use of animation can help a station recruit customers loyal to competing stations, while continuing to satisfy, and even improve their standing with, their own core viewer base. When asked if they would be more inclined to watch local news that had detailed animation and graphics explaining the news story, viewers generally responded positively, with support levels rising from 44% to 56%.
The results of our multi-year project, we hope, provide news stations with evidence that can guide strategic decisions in the years ahead, as they try to attract new audiences, retain their dedicated viewers, and make progress on the transition to the digital-based delivery of news. While no silver bullet, animation and graphics can be differentiating factors in the race to move ahead in a market. Such storytelling innovations can also signal to prospective employees that a given news outlet is trying new techniques and is open to changing what can still feel like a stale format across many of the country’s broadcast markets.
Two overarching ideas, we believe, are worth taking back to newsrooms. The first relates to the problem of dealing with complexity. The current era demands a pivot from reacting to the news cycle to managing a protracted coverage cycle with an emphasis on context, trends, and outcomes. Graphics and animation assist in the understanding of more complex issues, as they can capture sequences of events, illustrate geography, aid in comparison, and connect the dots. They enable a deeper understanding, and a higher level of retention, of the facts at hand.
A second theme relates to our era of active audience choice, and the demands this new ethos makes on local TV news producers. Local news consumers are taking a more active role in their news consumption, flowing between brands and platforms to get the content they need. The fragmentation of news and the decline in allegiance is as much a response to frustration as it is to motivation. Accordingly, our data suggest younger audiences are responding to strong visuals; we find strong preference for the animated approach, especially for the younger demographics (ages 18 to 24). Importantly, our research reveals that enhancing broadcasts with graphics and animation can both attract new viewers as well as continue to satisfy––and even impress––a station’s loyal core audience base, even in this volatile news environment.
We conclude by underscoring a series of steps that local TV news stations can take. The first is to prioritize animation and graphics in storytelling. We urge news producers not to think of animation and graphics as something to be added to a story after it has been thoroughly reported on. Determine early on which stories could benefit from animation; perhaps there are stories which cannot be told without it. Can investigative data be visualized? Does a complex process call for a visual explanation? Can a simple motion sequence say what generic b-roll and interview clips cannot? Can highlighting action steps onscreen help citizens understand their options in responding to local issues?
Second, it is imperative that stations with resources hire an animator (or a Visual Content Producer, as we have called them) and/or provide animation and graphics training and tools to news teams. We suggest thinking about making this investment as part of overall newsroom or station group strategy for evolving media products both on-air and on digital platforms. The animators in our experiment were called Visual Content Producers for a reason: they are producers involved in the editorial process. Include the animators early on in the reporting as ideas are being developed and let their expertise help guide the storytelling and production for added effectiveness. Even if an animator role is not in a station’s budget, management can help editors in this role by giving them animation training and tools, including Adobe After Effects.
For our experiment, we hired two VCPs, placed them in newsrooms in Chicago and Boston, and compensated them $85,000 for their year of work. We also factored in 30% for benefits ($25,500), plus $2,500 for specialized animation software including Autodesk Maya for a total budget of $113,000 for each station. We believe this salary is on the higher-end of the range that could be offered, and newsrooms could reasonably hire a young animator with Millennial and Gen Z sensibilities at a competitive lower salary, with room for growth.
Did the investment pay off? While it’s difficult to tease out the effects of a single strategy on our test stations’ overall annual revenue, a local news team can be confident it is succeeding if it can increase (1) ratings/viewership, and (2) digital engagement. Both WLS-TV and WCVB-TV saw their ratings increase in 2020 during the time the VCPs worked at the stations. To be fair, this clearly had something to do with the pandemic and people spending more time at home in front of their televisions, relying on up-to-the-minute coverage more than ever. But both stations also believe the VCPs added meaningful value that made the investment more than worthwhile.9
Third, create a next-generation storytelling team that is focused on new ways of delivering content on-air and on all digital platforms. Our audience gets more and more of their news through digital platforms, but stations still focus most of their resources on on-air products. A next-gen storytelling team is not a gimmick. It’s an attempt to pull a group of employees from throughout the newsroom to help translate their ideas about innovation in both of these areas into reality. Newsroom collaboration with smart and creative people who believe in the power of the medium can lead to fresh approaches on-air and online that will better serve audiences of all ages.
Finally, stations should empower current graphic design pros and work to achieve buy-in on all levels, from producers and reporters to photographers and editors. Hiring an animator when a station already has a graphic designer may “ruffle some feathers.” We saw this in our industry partnerships and believe an open dialogue about the role, and how it fits in with the overall station objectives, is key. In some cases, prioritizing animation and graphics with the current graphic design team may be the best approach. It is imperative to help them understand that the newsroom is valuing what they do more than ever so they do not view this change as a threat to their jobs.
This report represents the culmination of four years of research, experimentation, teaching and learning, and engagement with the local TV news industry. We believe that, contrary to predictions of local TV’s demise in the years ahead, the local television news industry has the potential to find new ways to cement its relevance for the American public. Yet fundamental shifts in audience preferences and expectations, fueled by technological disruption, are changing the market for local TV news. Forward-looking news producers must respond to these changes and seize opportunities to reassert the importance of professional, high-quality video news in American communities.
Liz Allison and Laurie Slap at the Stanton Foundation have supported this project with encouragement and insight through multiple phases. The Foundation’s support has been essential, and Northeastern faculty and students alike are deeply grateful.
Visual Content Producers Adriana Aguilar and Bob Curran, both incredibly talented animators and video journalists, were instrumental in this research. They took a risk spending a year doing innovative and novel work at a major station. That work proved foundational for this report. We thank the newsrooms and management at WLS-TV Chicago and WCVB-TV Boston for their wonderful partnerships.
We would like to thank all of the Northeastern students who have worked on this project over the years, many of whom have gone on to become distinguished young journalists in their own right: Niyah Gonzalez, Zach Ben-Amots, Andy Robinson, Felippe Rodrigues, Danae Bucci, Pirzan Turel, Daniel Bruzzese, Dalia Sadaka, Pavithra Rajesh, Audrey Wang, Sofia Perez, Sofia Kato, Guy Ovadia, Milton Posner, Jake Egelberg, Yuan Hua, Gabriel Cohen, Brooks Sutherland, Alejandro Serrano, Cole Albert, Will Bryan, Patrick Strohecker, Kimberly Mehrtens, Shraddha Kakade, Veer Mudambi, Yuan Tian, Olivia Whitaker, Joseph Annis, and Rachel Grozanick.
You can see many of our project alumni on screen now on broadcasts across the country (or working behind the scenes to make news happen).
Our gratitude again goes to Seth Geiger and all those at his firm SmithGeiger. Seth’s wisdom has been critical. It has been an amazing journey together.
Special thanks to Jim Goff and Mark Longchamps for their shooting and editing work on our summary research video.
We would also like to thank Susan Conover, Ariel Rodriguez, Tammi Westgate, and Katherine Calzada for their vital work in helping us administer this project. Our thanks to School of Journalism Director Jonathan Kaufman and Elizabeth Hudson, Dean of the College of Arts, Media and Design, for valuing this work and supporting it throughout.
Further information about the experiments and findings are contained in this slide deck. To compare with the prior experiments, published in 2019, see these accompanying slides.
For researchers or practitioners looking to build upon the data, please send inquiries to m.beaudet@northeastern.edu and j.wihbey@northeastern.edu.
Abernathy, P. M. (2020). News Deserts and Ghost Newspapers: Will Local News Survive?. University of North Carolina Press.
Beaudet, M., Campbell, A. & Wihbey, J. (2021). Reinventing Local TV News Part I: The Case for Video Innovation and Animation. RTDNA, https://www.rtdna.org/article/reinventing_local_tv_news_the_case_for_video_innovation_and_animation_part_i?
Beaudet, M., Campbell, A., & Wihbey, J. (2021). Reinventing Local TV News Part III: The Case for Changing the Way You Tell Stories. RTDNA, https://www.rtdna.org/article/reinventing_local_tv_news_part_ii_the_newsroom_animator_experiment
Beaudet, M., & Wihbey, J. (2019). Reinventing Local TV News: Innovative Storytelling Practices to Engage New Audiences. The Shorenstein Center on Media, Politics and Public Policy at the Harvard Kennedy School and Northeastern University’s School of Journalism.
Gollust, S. E., Fowler, E. F., & Niederdeppe, J. (2019). Television news coverage of public health issues and implications for public health policy and practice. Annual Review of Public Health, 40, 167-185.
Lee, Y., Park, S. A., Lee, H., Willis, E., & Cameron, G. T. (2019). Resources aren’t everything, but they do help: assessing local TV health news to deliver substantive and useful health information. Journal of Communication in Healthcare, 12(1), 13-22.
Levendusky, M. S. (2021). How Does Local TV News Change Viewers’ Attitudes? The Case of Sinclair Broadcasting. Political Communication, 1-16; Martin, G. J., & McCrain, J. (2019). Local news and national politics. American Political Science Review, 113(2), 372-384.
Pew Research Center. (2021). Local TV News Fact Sheet. https://www.pewresearch.org/journalism/fact-sheet/local-tv-news/
Center News

Center News

Center News