
Videos
Understanding the national debt and the risks of a fiscal crisis
![]()
Reports & Papers

Updated April, 2019
Authors (listed in alphabetical order):
Matthew A. Baum, Kalb Professor of Global Communication, Harvard Kennedy School
Bryce J. Dietrich, Research Fellow, Shorenstein Center on Media, Politics and Public Policy, Harvard Kennedy School
Rebecca Goldstein, PhD Candidate, Harvard University Department of Government
Maya Sen, Associate Professor of Public Policy, Harvard Kennedy School
Download a PDF copy of this paper here.
Supplemental Information for this study can be found here.
The 2020 U.S. Census will, for the first time since 1950, ask about residents’ citizenship status. The effect of doing so on census completion across different racial/ethnic groups is, however, unknown. We introduce the notion of contextual sensitivity to explain how seemingly innocuous questions can become costly to answer in certain political environments. Using this concept and a large survey experiment (n = 9,035 respondents), designed to mirror the appearance and substance of the 2020 Census, we find that asking about citizenship status significantly increases the percent of questions skipped, with particularly strong effects among Hispanics, and makes respondents less likely to report having members of their household who are of Hispanic ethnicity. When extrapolated to the general population, our results imply that asking about citizenship will reduce the number of Hispanics reported in the 2010 Census by approximately 6.07 million, or around 12.03 percent of the 2010 Hispanic population.
Whether it is defining Native Americans as non-citizens in 1800 or introducing a “mulatto” category in 1850, the classification of race and ethnicity on the U.S. Census has long been inherently political (Nobles 2000). This is why many paused when the Census Bureau announced it would include, for the first time since 1950, a question on residents’ citizenship status on the 2020 Census. An obvious concern is that some residents may refuse to participate altogether. Another less-well understood concern is that such a question may make any omissions more difficult to interpret. Are respondents who fail to report a Hispanic household member doing so in order to avoid potential prosecution? Or are they simply forgetting to include pertinent information? This ultimately affects data quality, which carries broader implications for the way federal funds are allocated and congressional districts are apportioned.
Moreover, given the current conservative rhetoric and policies regarding immigrants and immigration, some U.S. residents – particularly Hispanics – may be primed to be skeptical of the government’s motives if the citizenship question is introduced. We argue this kind of surrounding political environment can make some, intrinsically innocuous questions more costly to answer. We refer to this as contextual sensitivity. For example, although some may view the citizenship question as just another demographic variable, in an environment where the Trump White House has heavily primed Hispanic distrust in the government, others may perceive the same question as unfairly targeting specific groups or as discriminatory. Contextual sensitivity is important from a methodological viewpoint: since there are few material benefits to completing most surveys, any increased costs due to contextual sensitivity, even if relatively limited, can lead to non-random increases in item non-response (Berinsky 2004).
The proposed introduction of a citizenship question on the 2020 U.S. Census is an ideal – and particularly important – context within which to study this question. First, any contextual sensitivity could lead to the underreporting of certain groups, thus having dramatic policy repercussions. For example, 132 federal assistance programs depend on accurate Census estimates in order to properly distribute almost $690 billion (Hotchkiss and Phelan 2017). Second, as some particularly disturbing past examples show (Nobles 2000), the Census often reflects contemporary constructions of race and ethnicity, which means a study of the citizenship question is also inherently a study of the politics surrounding race in the United States.
Although understanding the effect of the citizenship question has important implications for political science research, an upcoming Supreme Court case makes our study especially timely. Prior research (e.g., Brown et al. 2018) has found some evidence the citizenship question may lower census participation, but these findings are derived from observational data and cross-survey comparisons, which are ill-suited for estimating the causal effect of including (or not including) questions that ask about residents’ citizenship. To our knowledge, we are the first to employ a survey experiment that mirrors the form and content of the actual Census which makes our study especially relevant to this important public policy question.
Using a randomized controlled trial (RCT), we find that asking about U.S. citizenship significantly reduces the overall share of questions that respondents answer, with suggestive evidence that the effects are more pronounced among Hispanic respondents. We also find that the citizenship question significantly reduces the number of household members reported as being Hispanic. These patterns are particularly stark among Hispanics who report being born in Mexico or Central America. Extrapolating our results to the general population, we estimate that asking about citizenship would reduce the share of Hispanics recorded by the Census by approximately 6.07 million, or around 12.03 percent of the 2010 Hispanic population – a sizable reduction in the share of the U.S. population that would be recorded as Hispanic.
We designed our survey experiment to match the short form of the U.S. Census, with the questions taken verbatim from the Census’ proposed questions. A third-party vendor (Qualtrics) recruited the survey panel and implemented the study in two waves. The first wave (n = 4,104) began on October 19, 2018 and targeted non-Hispanics (employing an English survey instrument), using self-reported demographic information maintained by Qualtrics. The second wave (n = 4,931) began approximately one week later (on October 25, 2018) and targeted Hispanics (using English and Spanish survey instruments) in order to facilitate meaningful subgroup inferences. In Section S2 of the SI, we report demographic breakdowns for both waves of our survey.
To evaluate the impact of asking about household members’ citizenship on item non-response and response quality, we randomly assigned half of the respondents (n = 4,497) to receive a “Citizenship Treatment” in which we asked, for each member of their household, “Is this person a citizen of the United States?”. The other half (n = 4,538) did not receive the citizenship question for any household member. Because the Census Bureau has not yet indicated where the citizenship question will be located within the 2020 Census, we also randomly rotated the order in which the citizenship question appeared, conditional on the household member in question.
An obvious difference between our study and the actual U.S. census is our status as academic researchers, which might lead to confidence among respondents that data would not be used for immigration purposes. To assess this, we also randomly assigned half of the respondents (n = 4,454) to receive a “Census Prompt” treatment, independently of the first randomization, consisting of a short note at the bottom of their consent form saying “Your responses will be shared with the U.S. Census Bureau,” and requiring respondent consent. The other half (n = 4,581) received no prompt. (Additional details on survey logistics can be found in Sections S1-S2 of our Supplemental Information or SI.)
We now turn to our core results concerning treatment effects on item non-response and the underreporting of Hispanic household members. These results are outlined in Tables 1 and 2.
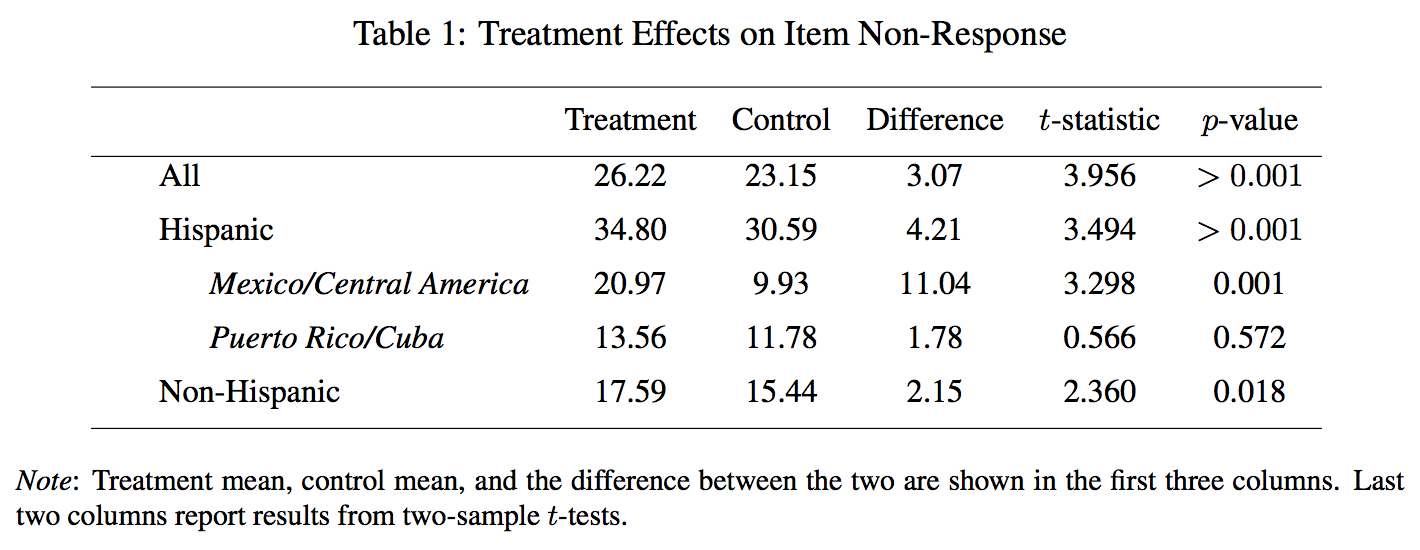
Beginning with Table 1, we operationalize survey item non-response as the percent of the survey questions for which the respondent submitted a response. Since our Citizenship Treatment was not introduced until Q5, we only consider questions appearing after this question when assessing treatment effects. Using this measure, we find receiving the Citizenship Treatment increases the overall share of questions skipped by 3.07 percentage points (t-statistic = 3.956, p-value less than 0.001). We find the Census Prompt does not significantly affect the share of questions skipped after Q5 (t-statistic = 0.063, p-value = 0.950). However, in the SI, we show the Census Prompt does significantly increase the percent of questions skipped in Q1-Q4 (t-statistic = 2.322, p-value = 0.020). We suspect that after the citizenship question – where we find consistent results throughout our study – appears, it’s relatively greater salience likely overwhelms the effect of the Census Prompt.
Consistent with our discussion of contextual sensitivity, we also find suggestive evidence that this effect was more pronounced for Hispanics, who skipped 4.21 points more of the questions after the Citizenship Treatment was introduced (t-statistic = 3.494, p-value is less than 0.001). Given that the current administration has disproportionately targeted its anti-immigrant policies and rhetoric towards Hispanics from Mexico and Central America, in our pre-analysis plan we predicted more pronounced treatment effects for Hispanics originating from these countries. As anticipated, for these respondents, after receiving the Citizenship Treatment the percent of questions skipped increased by a much larger 11.04 percentage points (t-statistic = 3.298, p-value = 0.001). Since Hispanics who originate from Puerto Rico and Cuba tend to be U.S. Citizens, we also pre-registered this subgroup as an important point of comparison. As also anticipated, the corresponding effect among Hispanics who listed Puerto Rico or Cuba as their birth country was far smaller: 1.78 percentage points (t-statistic = 0.566, p-value = 0.572). We also found a smaller difference of 2.15 percentage points for non-Hispanics (t-statistic = 2.360, p-value = 0.018).
A key concern is whether asking about citizenship would affect respondents’ willingness to report important demographic information, like household members’ race or ethnicity, especially given the current political environment which may make such questions contextually sensitive. Conditioning on the number of household members initially reported by the respondent, the Citizenship Treatment is associated with a 3.25 percentage point increase in the share of questions skipped about members’ race/ethnicity (t-statistic = 4.131, p-value less than 0.001). The corresponding effect of the Citizenship Treatment among Hispanics is more pronounced: a 4.86-point increase (t-statistic = 3.951, p-value less than 0.001).
As predicted, we again see even larger, significant effects for Hispanics listing Mexico or a country in Central America as their country of birth. Here, the Citizenship Treatment is associated with a 13.81-point increase in skipped race/ethnicity questions (t-statistic = 3.369, p-value less than 0.001). Finally, among Hispanics who listed either Puerto Rico or Cuba as their country of birth we do not find a significant effect (t-statistic = 0.530, p-value = 0.597). We also see a smaller and insignificant difference of 1.81 percentage points for non-Hispanics (t-statistic = 1.961, p-value = 0.50).
Another concern is the possibility that information about citizenship status could be used against families with non-citizen children. We thus also consider whether the Citizenship Treatment leads to more questions skipped regarding household members’ ages. Conditional on the number of household members initially reported, respondents who received the Citizenship Treatment are significantly more likely to skip the questions concerning household members’ ages, on average by 3.32 percentage points (t-statistic = 4.111, p-value less than 0.001). We see suggestive evidence that the effect is stronger among Hispanics, who experience a larger, statistically significant increase in questions skipped of 4.56 percentage points (t-statistic = 3.597, p-value less than 0.001).
Once again, as expected, we find even larger, and significant, effects for Hispanic respondents who report being born in either Mexico or a Central American country. For these respondents the Trump administration’s rhetoric and policies regarding immigrants and immigration appears, as expected, to have made questions regarding household members’ ages contextually sensitive, leading to fewer responses when the citizenship question is introduced. We ultimately find the Citizenship Treatment is associated with a 10.95-point increase in the number of questions related to age and date-of-birth skipped (t-statistic = 3.274, p-value = 0.001). Among Hispanics who listed either Puerto Rico or Cuba as their country of birth we do not find a significant effect (t-statistic = 0.045, p-value = 0.964). Finally, we again see a smaller difference of 2.27 percentage points for non-Hispanics (t-statistic = 2.423, p-value = 0.015).
Because accurately counting racial/ethnic minorities has substantial implications for federal resource allocations, in Table 2 we consider the effect of the citizenship question on the share of household members identified by the respondent as being of “Hispanic, Latino, or Spanish Origin.” That is, we consider the percent of household members identified as Hispanic (as opposed to other ethnicities or non-responses) by each respondent. Since question order is randomized, we only consider household members whose race/ethnicity is assigned by the respondent after our Citizenship Treatment is introduced.
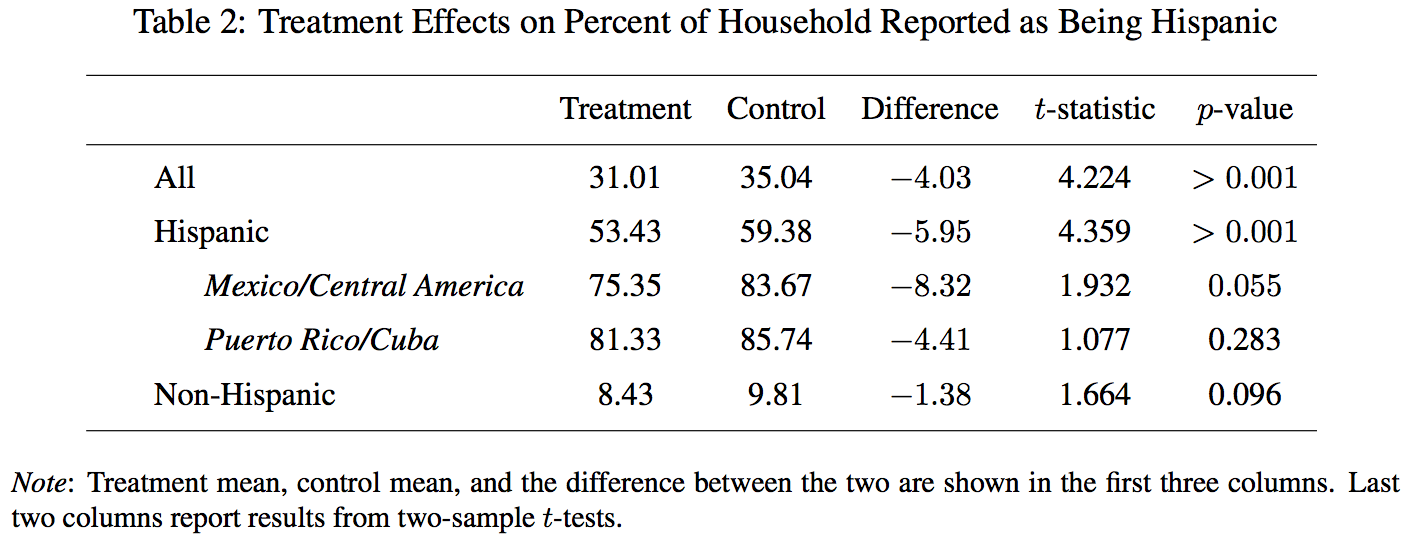
Table 2 shows – again consistent with our discussion of contextual sensitivity – those receiving the Citizenship Treatment reported fewer Hispanic household members (31.01 percent of households) compared to those in the control condition (35.04, t- statistic = 4.244, p-value less than 0.001). Hispanic respondents receiving the Citizenship Treatment were 5.95 percentage points fewer household members of Hispanic origin than their counterparts in the control conditions (59.38 vs. 53.43, t-statistic = 4.359, p-value less than 0.001). The corresponding difference among non-Hispanic respondents is a less significant 1.38 points (8.43 vs. 9.81, t-statistic = 1.664, p-value = 0.096).
We again see larger, significant effects for Hispanics listing Mexico or a country in Central America as their country of birth. Here, respondents receiving the Citizenship Treatment reported 8.32 percentage points fewer household members of Hispanic origin (75.35 percent, compared to 83.67 percent in the control condition; t-statistic = 1.932, p-value = 0.055). Once again, among Hispanics who listed either Puerto Rico or Cuba as their birth country, the corresponding difference is smaller (4.41 points; 81.33 vs. 85.74 in the control condition) and insignificant (t-statistic = 1.077, p-value = 0.283).
In the SI, we also conduct several robustness checks. First, because the Census Bureau imputes some missing data we replicate our results after separately imputing respondents in the treatment and control conditions. For example, in the imputed control condition, Hispanic respondents report that 73.02 percent of their household members are Hispanic. When receiving the Citizenship Treatment, these same respondents report 64.45 percent of their household members are Hispanic, a difference of 8.57 percentage points (t-statistic = 6.891, p-value less than 0.001). Second, we also replicate our main results using respondents who did not receive the Census Prompt. All of our results hold using this subgroup. For instance, for Hispanic respondents who did not receive the Census Prompt, receiving the Citizenship Treatment significantly decreases the percentage of household members reported as being Hispanic by 5.67 percentage points (t-statistic = 2.978, p– value = 0.003).
We now consider what, more precisely, our study might predict for the 2020 U.S. Census context in terms of the share of Hispanics that might be undercounted. Our survey purposefully oversampled Hispanics (51.10 percent of our sample) relative to the U.S. population (16.35 percent, as reported by the 2010 U.S. Census). To produce more nationally representative estimates, we created post-stratification weights using a raking algorithm, based on all available information about our respondents (their race/ethnicity, whether they were Democratic identifiers, and their state of residence, based on zip codes). (We provide more details in Section S2-S3 of the SI.)
Applying the estimated national-level treatment effect to the U.S. population, as reported by the 2010 U.S. Census (308,745,538), we estimate that asking about citizenship will reduce the number of Hispanics reported in the 2020 Census by 6,072,068 or 12.03 percent of the 2010 Hispanic population (50,477,594). The 95-percent confidence interval surrounding our estimate is 5,761,284 to 6,382,820, which represents a decrease of 11.41 to 12.64 percent relative to the 2010 Hispanic population. In 2016, before the current administration came to power and initiated its sustained pattern of severe anti-immigrant rhetoric and policies, six percent of all respondents and 7.40 percent of Hispanic respondents did not respond to the ACS citizenship question (Brown et al. 2018), which suggests that our estimates are reasonable, though admittedly suggestive.
Although we cannot say with certainty how the predicted undercounted Hispanics will be distributed, in some configurations congressional apportionment could be affected, with many worrying Texas and California may lose seats (Lind 2018). In Table S6 of the SI we estimate the effect of the citizenship question across all 435 districts. There we find in some districts where Hispanics represent a larger share of the population – especially in Southern California – our Citizenship Treatment would have a larger impact, which suggests apportionment could also be affected by introducing the citizenship question.
This study presents the first explicit causal exploration of the impact of asking about citizenship on the 2020 U.S. Census. We find that asking about citizenship status significantly increases the percent of questions skipped, with particularly strong effects among Hispanics, and makes respondents less likely to report having Hispanic household members. Aggregating this to the national level suggests that asking a citizenship question may lead to an undercounting of Hispanics of between 5,761,284 and 6,382,820 in the 2020 Census (based on 2010 figures).
We note two caveats regarding our study. The first is that we likely underestimate the effect of asking about citizenship status on the 2020 Census. Not only are we university affiliated academic researchers – and not the U.S. Government – and so respondent concerns over providing the government with personal information may not have inhibited participation in this survey, but our respondents were paid panelists and thus financially incentivized to complete the survey. The second is that our study was ill suited for estimating the causal effects of citizenship questions on household member undercounts. In order to mirror the actual census form, all citizenship questions appeared in our survey after respondents listed the number of members of their household. Additionally, unlike the Census Bureau, we had no “baseline truth” against which to compare reported household size. Future research might be better equipped to assess the potential impact of asking about citizenship status on household size reporting.
These caveats aside, the key takeaway is that including a citizenship question will likely result in undercounts of Hispanics and this is at least partially attributable to simple item non-response. Whether the source is breaking off from the survey or withholding information about some household members, item non-response is one of the main concerns surrounding the citizenship question (Lind 2018). A single respondent answers questions about everyone in the household, which means that any false or incomplete information about certain household members is equivalent to those individuals not responding to the survey. This is why a major part of the U.S. Census Bureau’s non-response follow-up operation focuses on contacting households that returned incomplete surveys (Walker et al. 2010).
Scholars have paid relatively little attention to the risks of item non-response introduced by including the citizenship question on the 2020 Census. Our study thus makes an important addition to the literature. In doing so, we provide a clear – and politically important – cautionary example for survey researchers. Whether researchers are administering the U.S. Census, American National Election Study (ANES), or simple experiments at their home institutions, questions about race and ethnicity are inherently political, and thus contextually sensitive, especially in the current political environment. Researchers should therefore take considerable care in formulating those and other demographic questions. Otherwise, survey response rates could be negatively affected. In this way, we provide a key foundation for future work on the importance of contextual sensitivity to survey research and studies of American politics, more broadly.
This research was supported by the Shorenstein Center on Media, Politics, and Policy at the John F. Kennedy School of Government, Harvard University. We thank Rafael Carbonell, Kyla Fullenwider, Candelaria Garay, Sunshine Hillygus, Horacio Larreguy, David Lazer, Michelle Lyons, O’Reilly Miami, Nicco Mele, Noelia Negri, Nathan Richard, and John Thompson for helpful comments and suggestions. We also thank Amaris Taylor for her help at Qualtrics. Liz Schwartz, Rebecca Roach, Carmen Nobel, Denise Ordway, and John Sides also helped immensely with the public facing versions of our paper.
References
Berinsky, Adam J. 2004. Silent Voices: Opinion Polls and Political Representation in America. Princeton, NJ: Princeton University Press.
Brown, J. David et al. 2018. Understanding the Quality of Alternative Citizenship Data Sources for the 2020 Census. Technical Report. U.S. Census Bureau.
Bureau, U.S. Census. 2017. Race & Ethnicity. Technical Report. U.S. Census Bureau.
De Leeuw, Edith D, Joop J Hox and Mark Huisman. 2003. “Prevention and Treatment of Item Nonresponse.” Journal of Official Statistics 19(2):153–176.
Hotchkiss, Marisa and Jessica Phelan. 2017. Uses of Census Bureau Data in Federal Funds Distribution: A New Design for the 21st Century. Technical Report. U.S. Census Bureau.
Lind, Dara. 2018. “The Citizenship Question on the 2020 Census, Explained.” Vox.
Nobles, Melissa. 2000. “History Counts: A Comparative Analysis of Racial/Color Categorization in US and Brazilian Censuses.” American Journal of Public Health 90(11):1738-1745.
Walker, Shelley et al. 2010. “2010 Census Nonresponse Followup Operations Assessment.” Technical Report. U.S. Census Bureau.
Videos

Videos

Videos