Reports & Papers
Reported Voting Issues: State and County Snapshots

Reports & Papers
The 2026 Voting Information Trends research initiative’s state and county-level reports are designed to help election officials and journalists identify areas where reported issues in elections and election-related information could deserve additional investigation.
The 2026 Voting Information Trends Research Initiative tracks how people get voting information and what problems they encounter when trying to vote. As part of the initiative, we monitor survey respondents self-reports of voting-related issues including misleading election messages, intimidation, and voter registration problems, to help identify areas that may need a closer look.
The reports below cover voting issues that survey respondents say they have encountered this election season.
| Problem | Counts when a respondent reports they… | Time window |
|---|---|---|
| Registration challenge notice | Got a notice that their voter registration was challenged or canceled, or that they were removed from the rolls. | Past month |
| Conflicting registration information | Got conflicting information about their voter registration. | Past week or month |
| Discouraged from registering | Someone tried to discourage them from registering or staying registered. | Past day, week or month |
| Misleading calls or texts | Got a text, email, message, call or robocall about the 2026 election that felt misleading, coercive or unusual. | Past day, week or month |
| Intimidation or harassment | Experienced or witnessed harassment or intimidation connected with voting or elections. | 2026 election cycle |
| Trouble with a voting task | Had trouble registering, checking their registration, or requesting, returning or tracking a mail ballot. | 2026 election |
The 2026 Voting Information Trends research Initiative tracks how people get voting information and monitors possible election-related problems reported at the county level. We focus on issues respondents say they have personally experienced or observed, including misleading election communications, intimidation, voter registration problems, and difficulties completing voting-related tasks. The goal is to identify signals that may warrant closer attention.
We survey about 1,000 U.S. adults each day through an online, nonprobability sample covering all 50 states and Washington, D.C. State-level quotas are used for race, ethnicity, age, and gender. We also collect additional responses from selected counties identified as higher risk by the Voting Rights Lab (VRL), whose 2026 risk index considers factors including electoral competitiveness, election laws and procedures, litigation, and concerns involving state and local election actors.
Counties with at least 50 respondents are ranked by the share of unique respondents reporting at least one monitored problem during the data-collection period. We also report results for individual problems, weekly trends, demographic groups, and when sample sizes allow, additional follow-up detail.
Weekly trends are shown only for questions that ask about experiences in the past day or week, and each respondent is counted once per week. Figures include a 95% margin of error based on sample size. We describe a county as higher than the national rate only when the difference is larger than that margin.
When a respondent selects a problem but then states in an optional written follow-up that nothing actually happened, we recode the response as not reporting the problem. These contradictions are identified using a large language model (LLM) assisted coding and reviewed by a member of the research team.
These results are signals, not estimates of prevalence. The survey is not nationally or locally representative, and results should not be used to estimate how common a problem is in the country or in any county. Figures are unweighted and describe the people who responded. Unlike individual reports found on social media, these responses come from a standardized survey using the same questions and time periods across respondents, allowing us to compare patterns across places and against a national benchmark.
The purpose of the survey is to identify issues that may warrant independent investigation or verification. Election officials, journalists, and other organizations can then assess those reports and respond when appropriate.
Because the data are self-reported, a response does not by itself verify that the reported problem occurred. Respondents may also interpret questions differently from researchers. For example, some reports of “misleading calls or texts” describe campaign messages rather than false voting information, and some registration notices may come from campaigns or advocacy organizations rather than election offices. These findings should therefore be treated as signals of where to look more closely, not counts of verified incidents.
The research team wrote and reviewed the “About the survey” section. The summaries of the results are filled in automatically from templates built with AI. All numbers come directly from the survey data. Automated text can contain errors, so readers should check the summaries against the tables and charts.
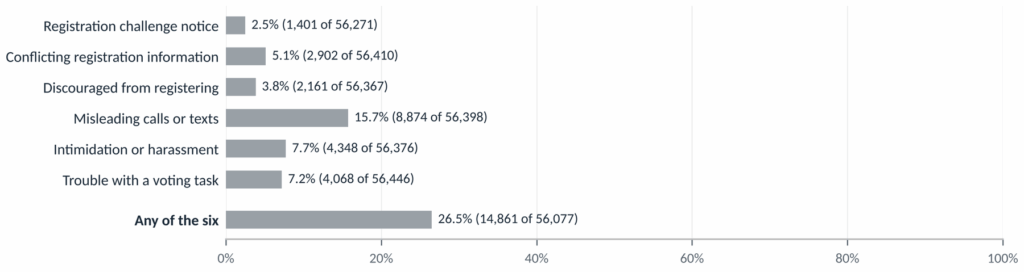
Between August 23 to October 26, 2026. 56,077 survey respondents answered all six questions about potential election problems.
26.5% of respondents (14,861 of 56,077) reported at least one of six election problems. The most common were misleading calls or texts (15.7%) and intimidation or harassment (7.7%); the least common was registration challenge notices (2.5%).
For full national data overview, click on any of the county-level reports below. Aggregated state and national data is included in all county reports.
These reports cover all counties that had more than 50 survey respondents between August 23 – October 26, 2026. Counties with fewer than 50 respondents are not included. State-level reports aggregate all responses within a state, and include counties with fewer than 50 respondents.
Visit the 2026 Voting Information Trends landing page to read all reports and explore the interactive dashboard.
Reports & Papers

Reports & Papers