Reports & Papers
Texas is the only state with above-average rates on all three voting problems measured in new survey

Reports & Papers
Nationally, younger voters report the most difficulty; unsuccessful attempts at voting-related tasks are associated with lower confidence that a vote will count
Texas is the only state where potential voters reported significantly higher-than-national rates of all three voting and registration problems measured in a new survey conducted as part of the Shorenstein Center’s 2026 Voting Information Trends series at Harvard’s Kennedy School. The survey measured respondents reports of trouble with voting-related administrative tasks, conflicting voter-registration information, and notices challenging or removing a registration.
The report, Voting and registration problems across the U.S. and in Texas, is based on a survey of 48,260 U.S. adults conducted August 23–October 19, 2026. Its analysis focuses on 41,016 “potential voters”—respondents who are eligible to vote and plan to register or say they probably or definitely will vote in the 2026 general election.
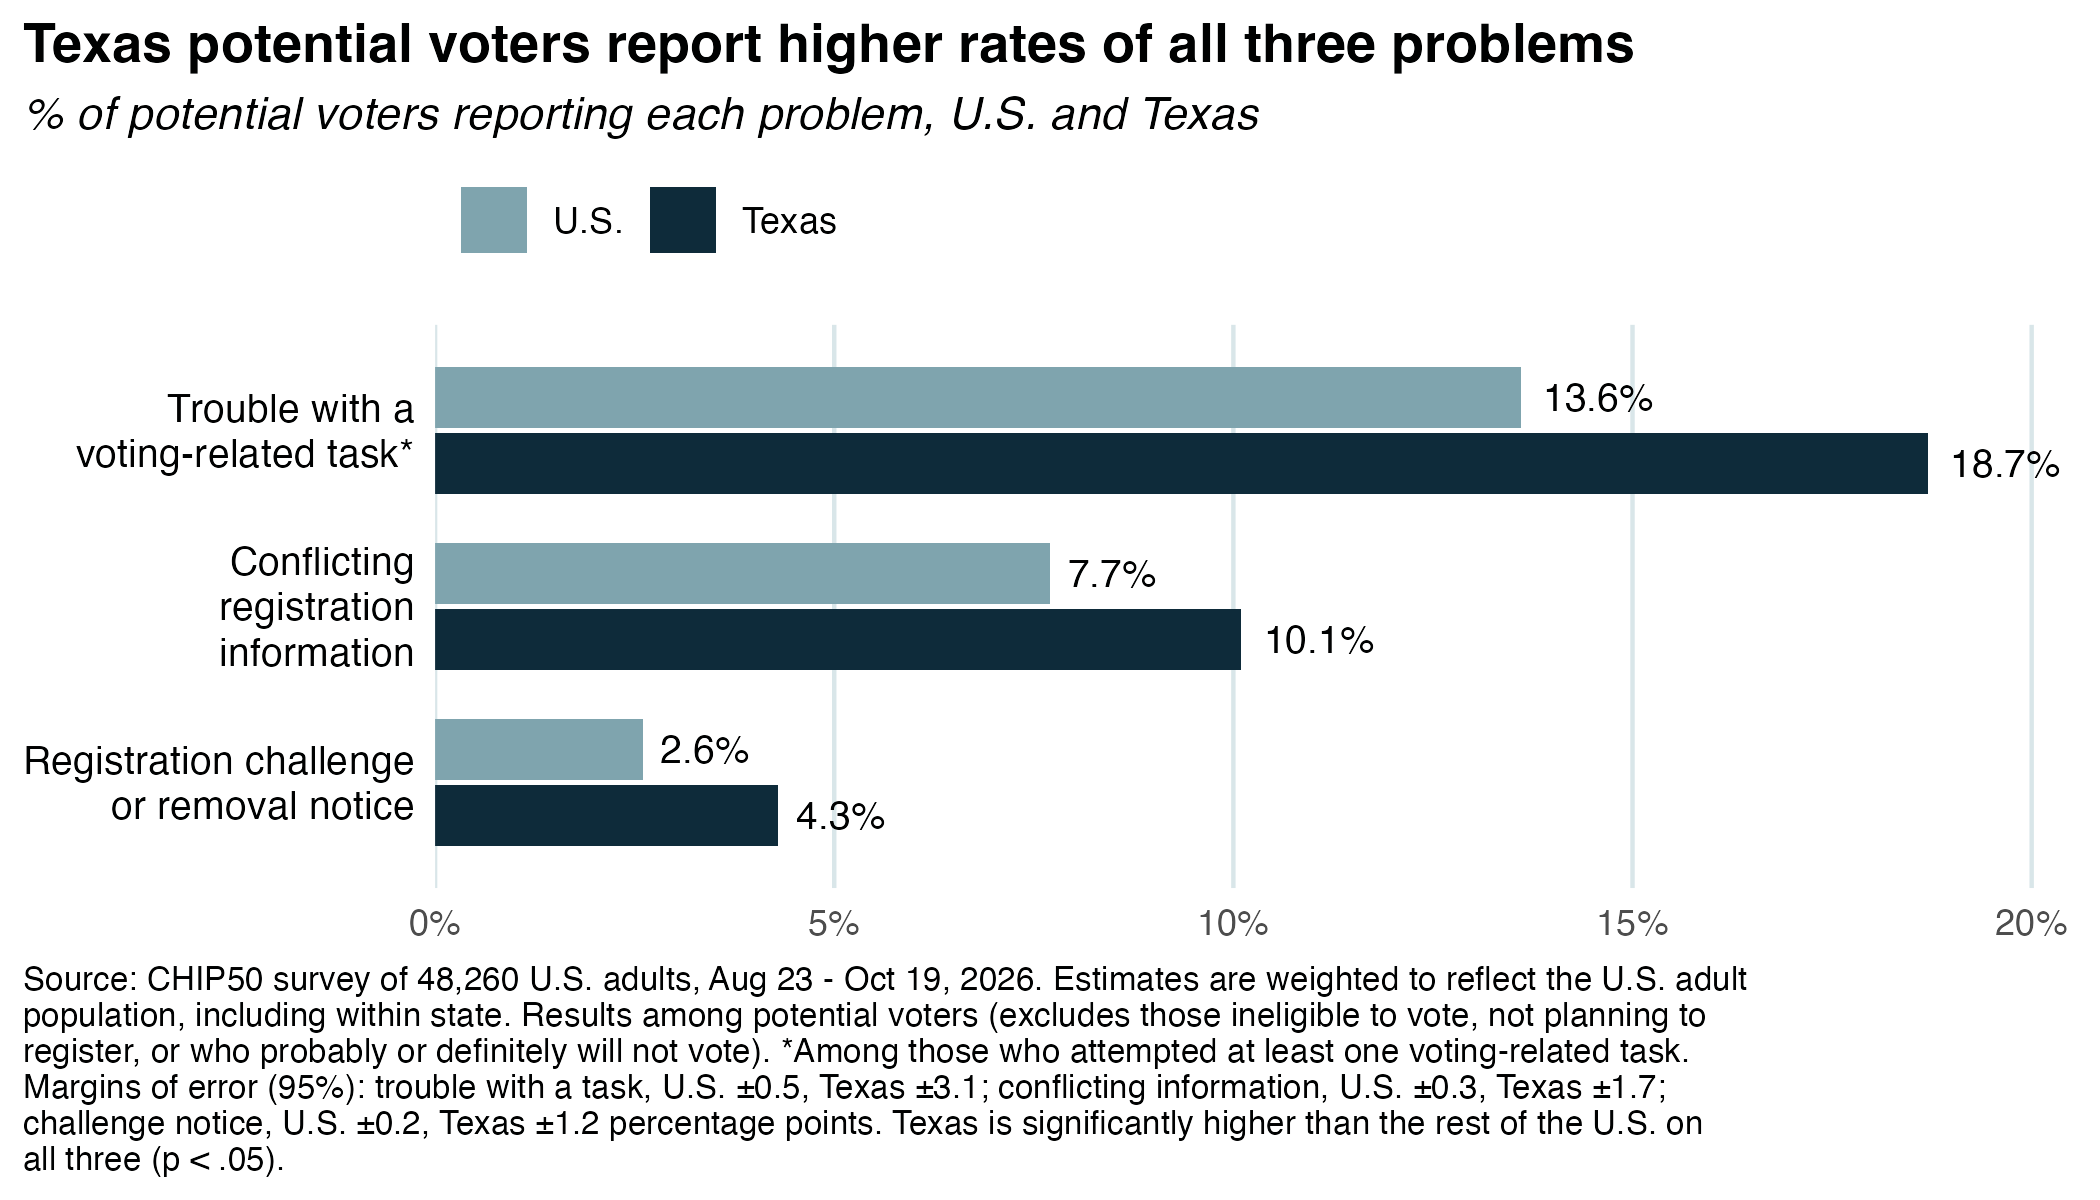
Across the country, 14% of potential voters who attempted at least one voting-related task reported trouble with at least one. Eight percent of potential voters reported conflicting information about their registration, and about 3% said they had received a notice that their registration was challenged, flagged, or canceled.
Younger potential voters reported the most difficulty. Among those ages 18–24 who attempted a task, 29% reported trouble with at least one task, 18% reported conflicting registration information, and about 5% received a challenge notice. Among potential voters ages 65 and older, the respective figures were about 4%, 3%, and 1%.
Nationally, non-white potential voters reported roughly twice the rates of white potential voters across the three measures. In analyses controlling for other characteristics, younger, Black, Hispanic, urban, and male potential voters remained more likely to report problems.
In Texas, 19% of potential voters who attempted a voting-related task reported trouble, compared with 14% nationally. Ten percent of Texas potential voters reported conflicting registration information, compared with 8% nationally; about 4% reported a registration challenge or removal notice, compared with about 3% nationally.
Texas was the only state whose rates were significantly above the national average on all three measures, including after the report corrected for multiple state comparisons. Other states were elevated on individual measures, but none stood out across all three.
Within Texas, patterns generally reflected the national findings. Controlling for demographic differences, Hispanic identity was associated with higher rates of reported task trouble and challenge notices, while age was associated with task trouble and conflicting registration information. Party affiliation was not a significant predictor of the three outcomes after controlling for other characteristics.
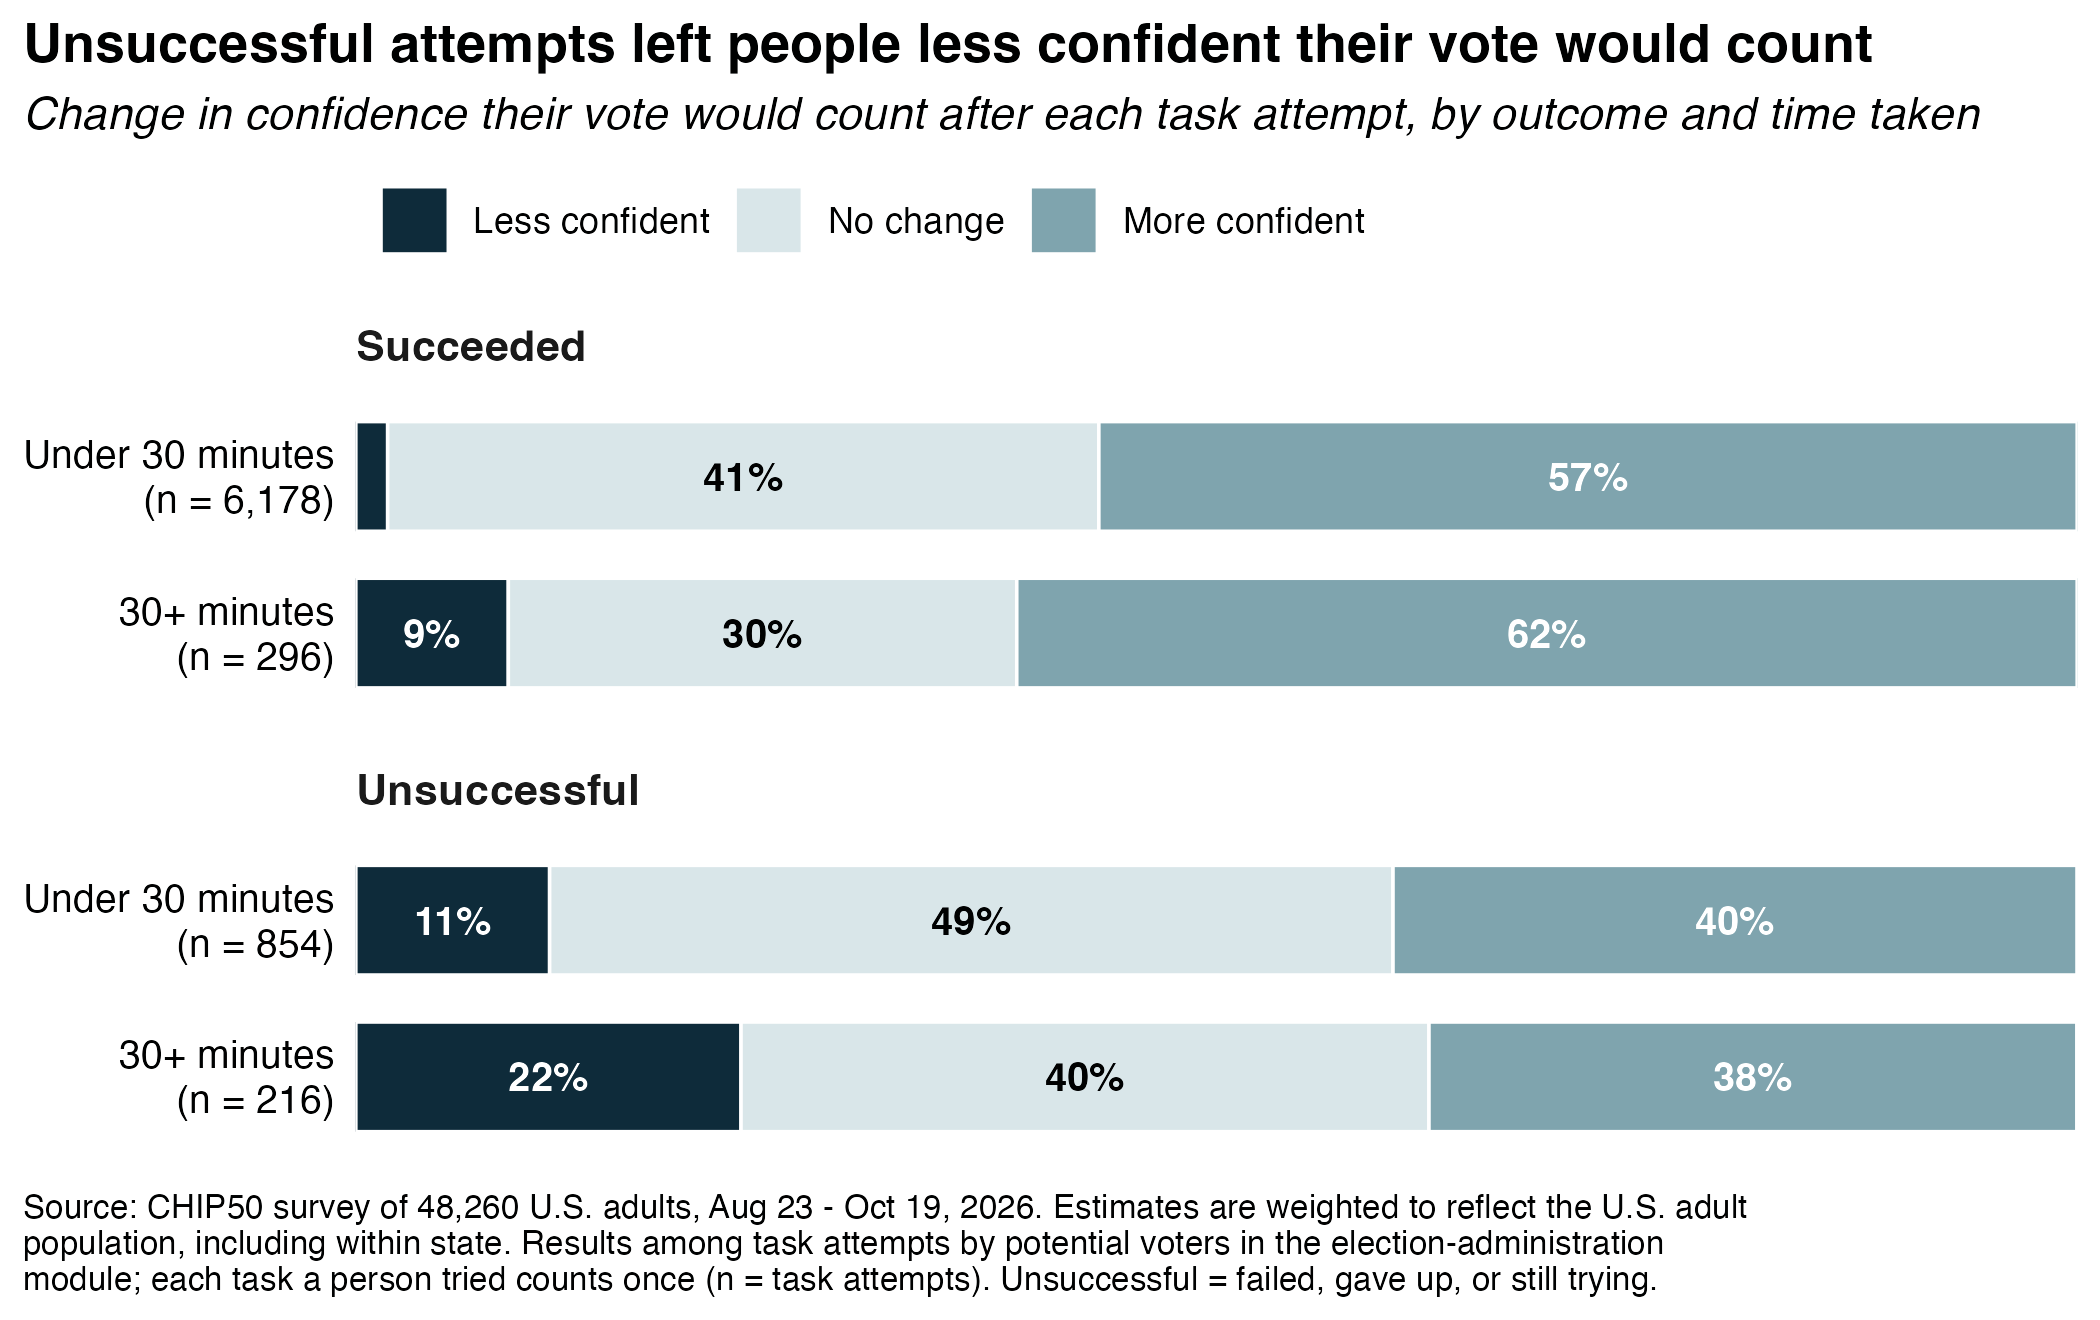
A separate election-administration module found that 20% of potential voters who attempted a voting-related task were unsuccessful at one or more tasks—meaning they failed, gave up, or were still trying. Among successful attempts, 57% left respondents more confident their vote would be counted and 2% left them less confident. Among unsuccessful attempts, 39% left respondents more confident and 13% left them less confident.
The report found that unsuccessful attempts—and, to a lesser extent, tasks taking 30 minutes or more—were associated with lower confidence. These are associations, not evidence that the experiences caused confidence to change.
The Shorenstein Center 2026 Voting Information Trends Reports are produced by the Shorenstein Center in collaboration with the National Internet Observatory at Northeastern University, the Ash Center for Democratic Governance and Innovation at Harvard Kennedy School, and The Civic Health and Institutions Project.
The survey was conducted online by PureSpectrum using a nonprobability sample, with results reweighted to match population characteristics within each state. The findings describe reported experiences; they do not establish how many people were unable to cast a ballot or whether the reported problems affected turnout or election outcomes.
Among potential voters nationwide who reported a challenge or removal notice, respondents most commonly said it came from an election office (47%); 31% cited a party or campaign. Respondents could select more than one source, and these answers do not establish who initiated a challenge or whether a registration was actually removed.
Reports & Papers
Reports & Papers

Reports & Papers