Reports & Papers
Most Voters in States Without Voter ID Requirements Wrongly Believe ID Is Required

Reports & Papers
New 50-state study also shows that voters who follow or have been exposed to news and information about voter ID laws are more likely to mistakenly think they must show ID to vote.
More than half of likely in-person voters who live in states that do not require identification to vote incorrectly believe that they must present an ID, according to a new 50-state study from the Shorenstein Center on Media, Politics and Public Policy.
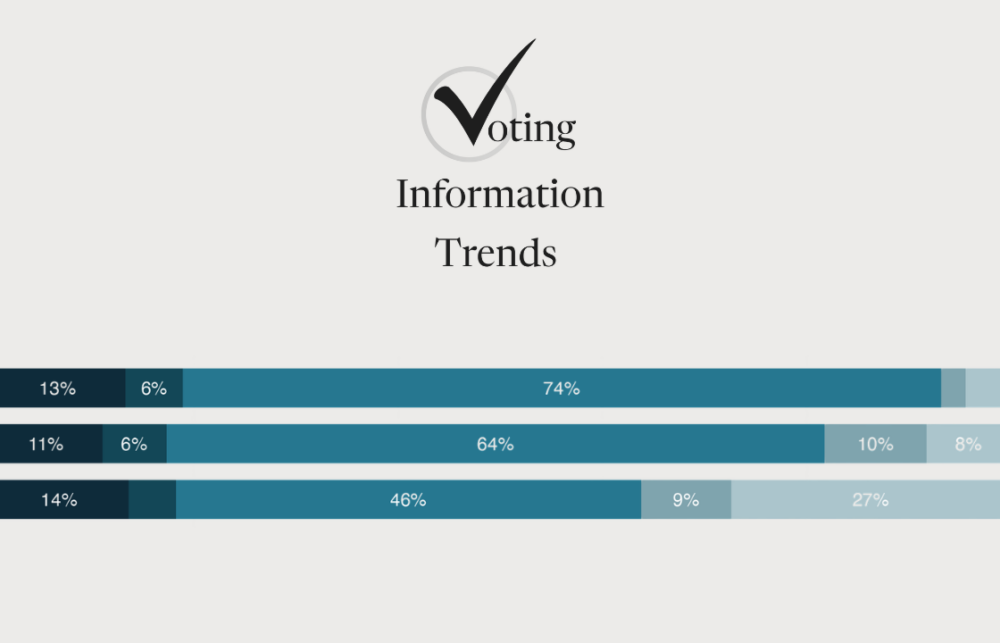
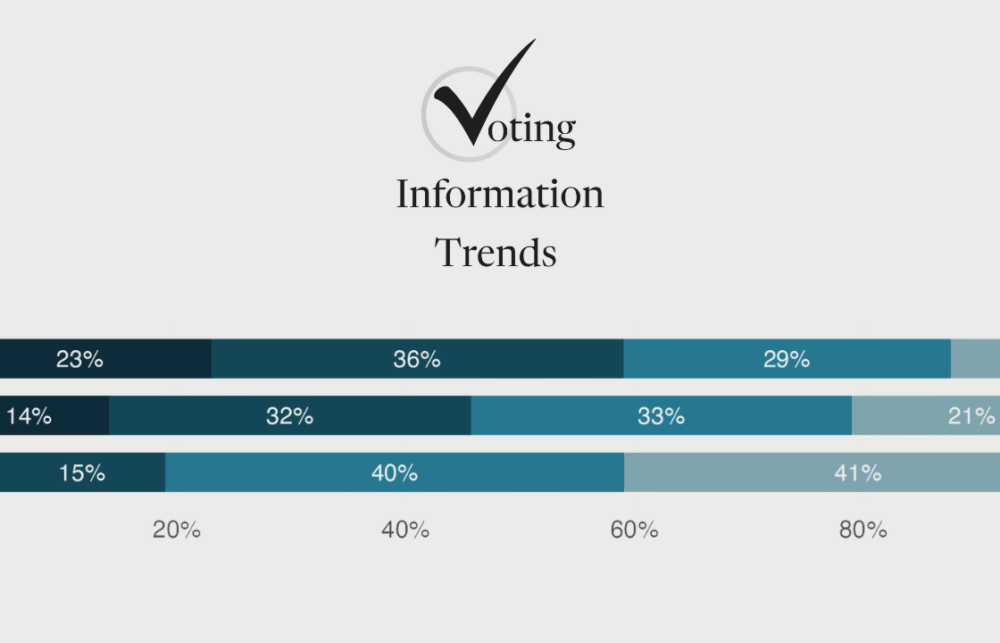
The survey of more than 44,600 U.S. adults found a sharp difference between states that require voter ID and states that do not.1 In states requiring photo identification, 83% of likely in-person voters correctly understood that ID is required. But in states with no voter ID requirement, only 31% correctly knew that they do not need ID to vote. 53% percent incorrectly believed that identification is required, while another 16% were unsure.
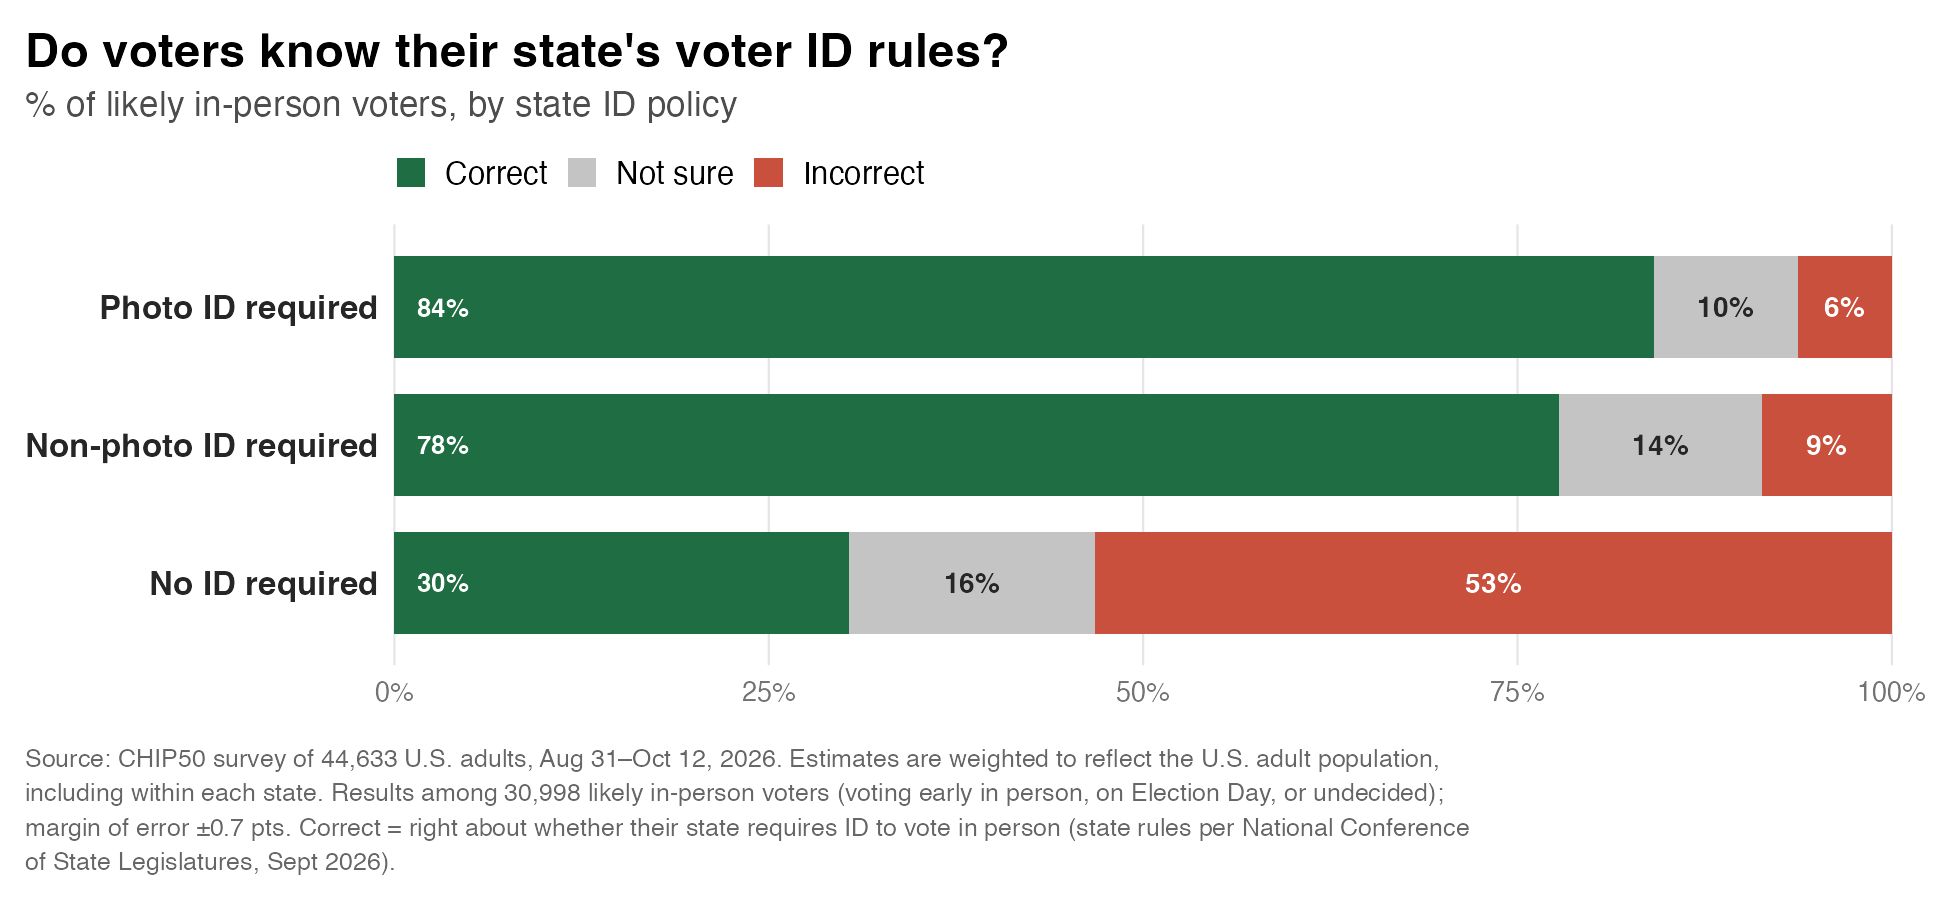
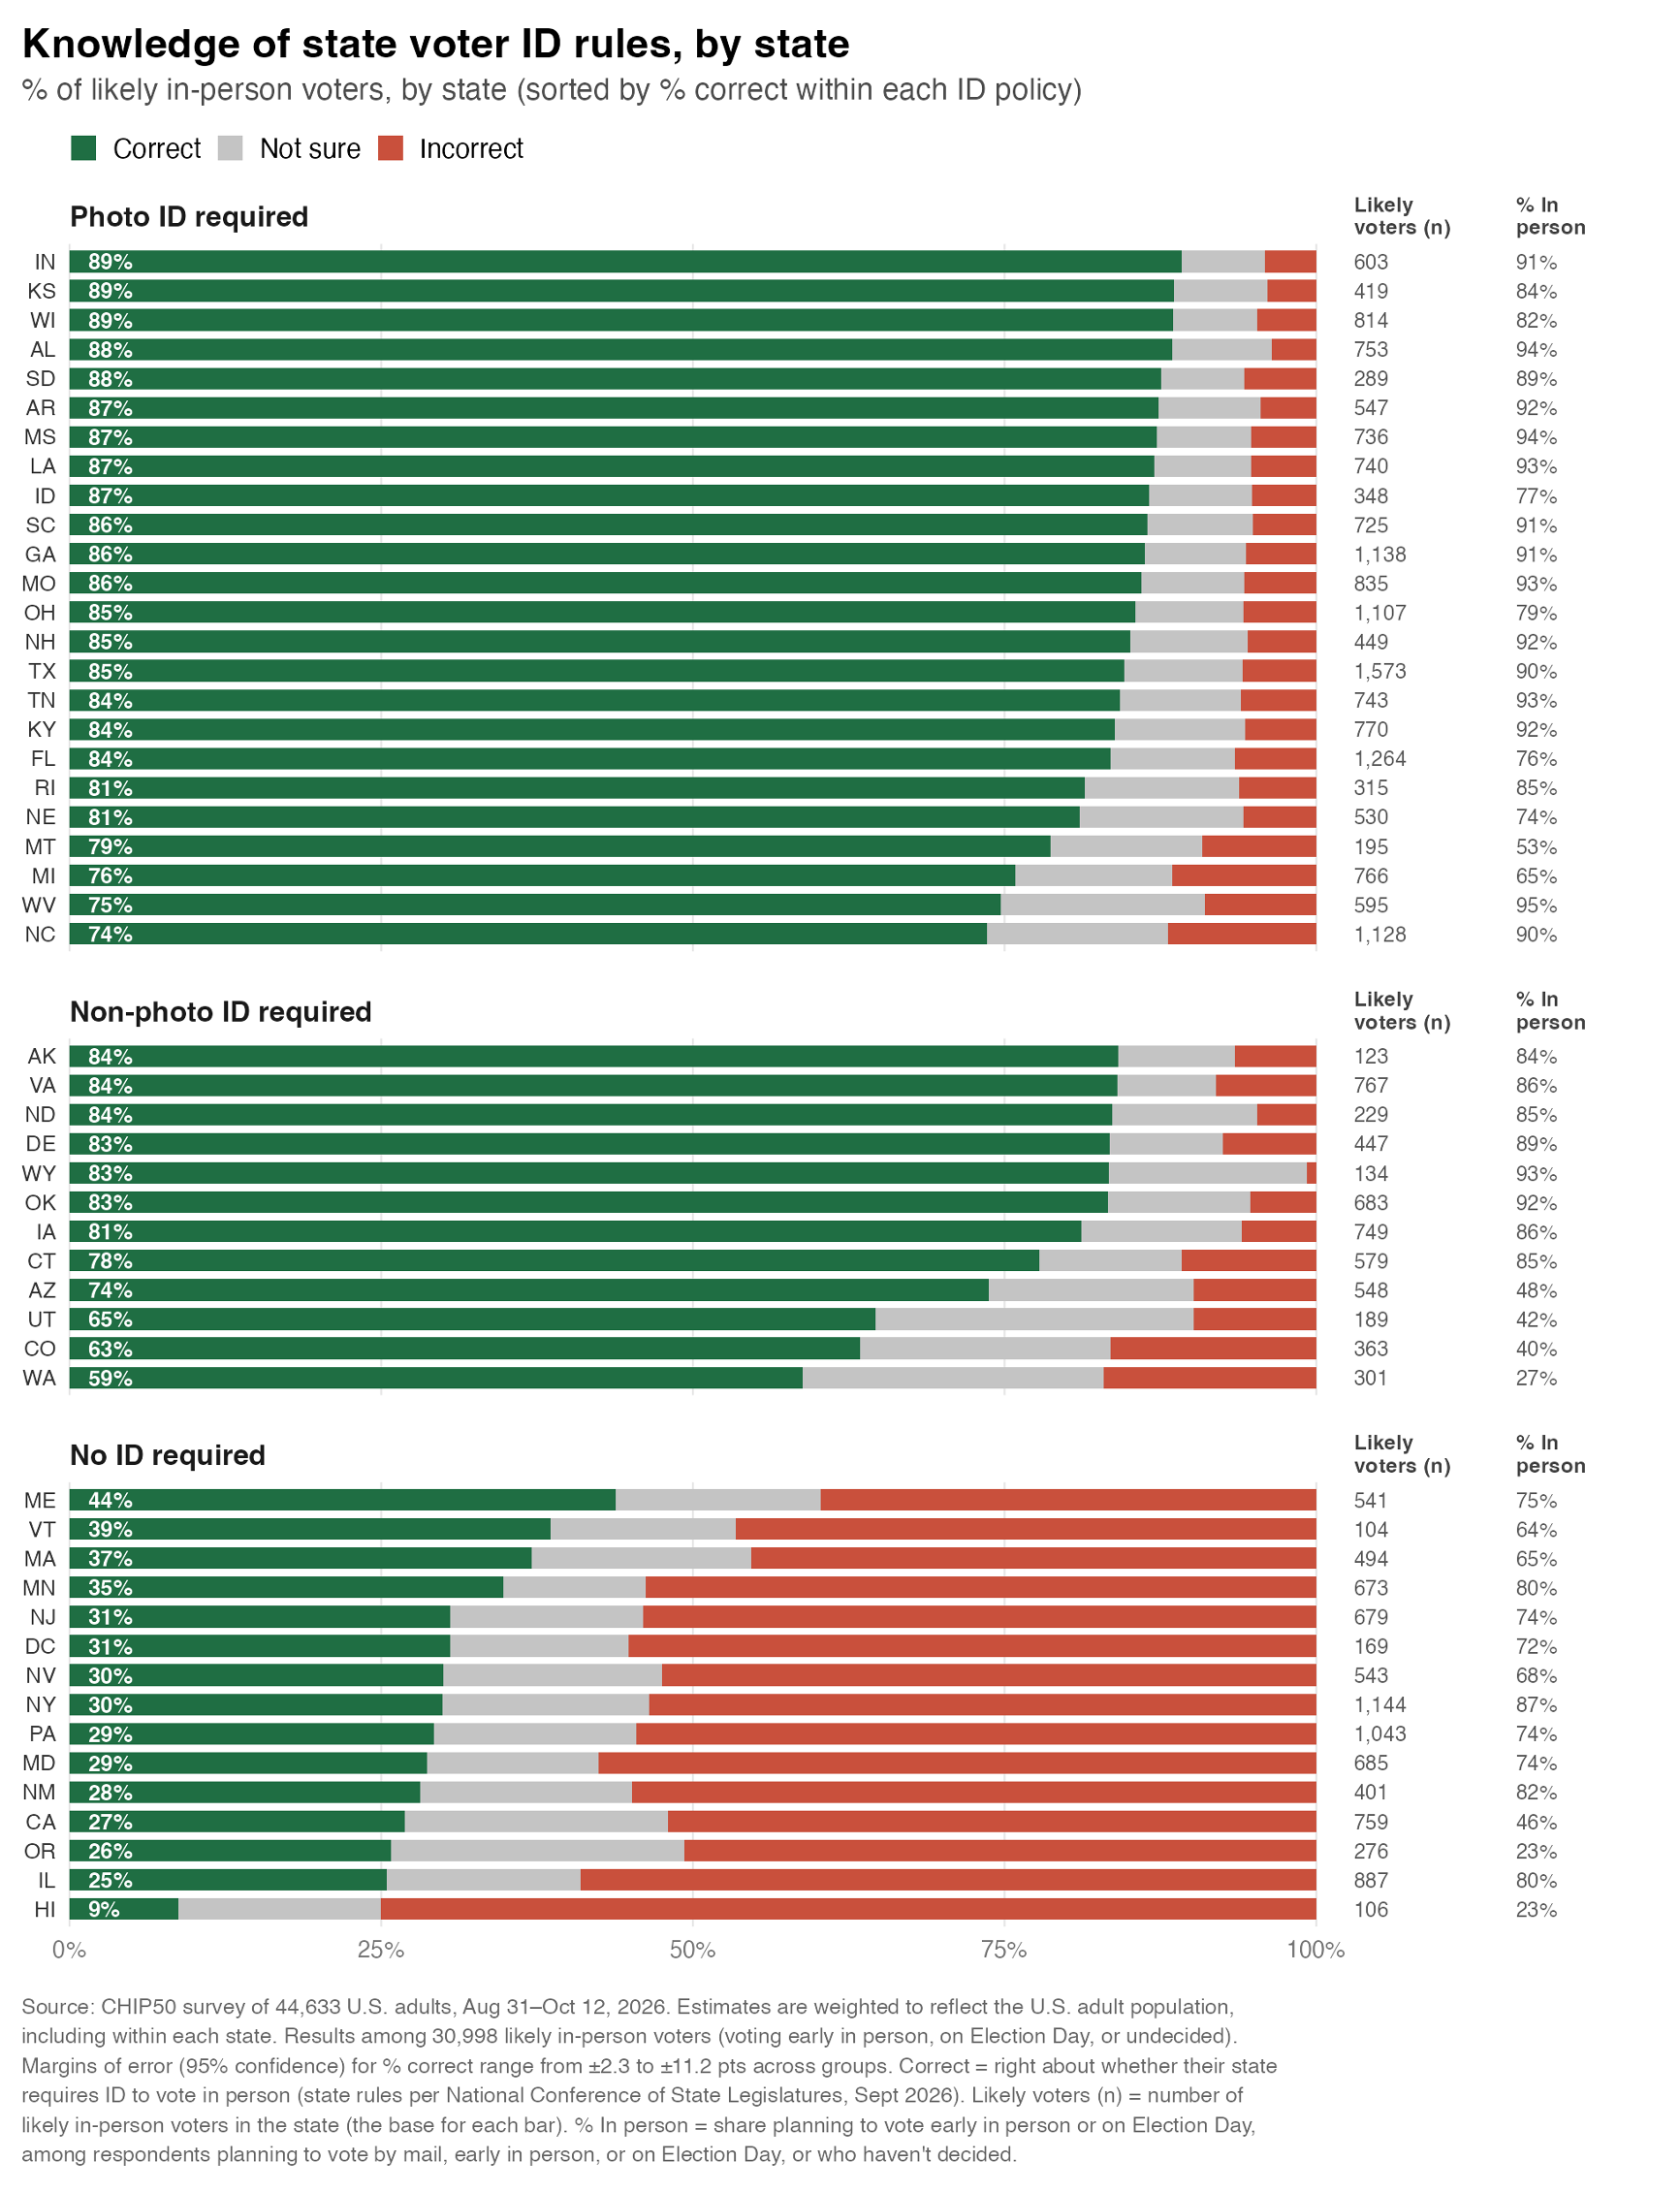
See citation 1, above, and the chart below for list of states in each category.
The findings suggest that encountering more information about voter identification rules does not necessarily leave voters better informed about the rules that apply to them. While people who paid more attention to general election news tended to more accurately identify their state’s ID laws, those who saw information specifically about voter ID in states where ID is not required were more likely to mistakenly think they needed ID to vote. The researchers think one possible explanation is that voters may see news and information about voter ID laws from other, more restrictive states and assume similar requirements apply where they live.
Though the study cannot establish a causal link between information exposure and knowledge, it found that, among similar voters in states requiring photo ID, seeing news or other information about voter ID requirements was associated with a 4-percentage-point increase in accurately identifying their state’s voter ID laws. In states where no ID is required, however, exposure to voter ID information was associated with a 9.8-point decrease in accuracy.
Encountering general information about voting or elections is more often associated with increased accuracy on voter ID laws. In states with no ID requirements, voters who report having seen general information about voting (how to vote, where to vote, etc.) were more likely to accurately identify their state’s voter ID laws, and those who report seeing no voting information were nearly 10 percentage points less likely to correctly identify their voter ID laws. At the most general level, voters who followed broad election news were more likely to know their state requirements in both states with voter ID requirements and no-ID states.
Information from election officials was associated with greater accuracy in states requiring photo or non-photo identification, though researchers found no significant association in states where no ID is required. The report suggests that election officials in those states may have an opportunity to communicate more explicitly that identification is not required.
In states without voter ID requirements, disparities in knowledge of applicable ID laws are particular pronounced. Only 17% of Black voters and 21% of Hispanic voters in those states correctly said that ID was not required, compared with 35% of white voters. Older voters and those with self-reported higher incomes tended to be more accurate in their knowledge of ID laws in these states than younger and lower-income voters.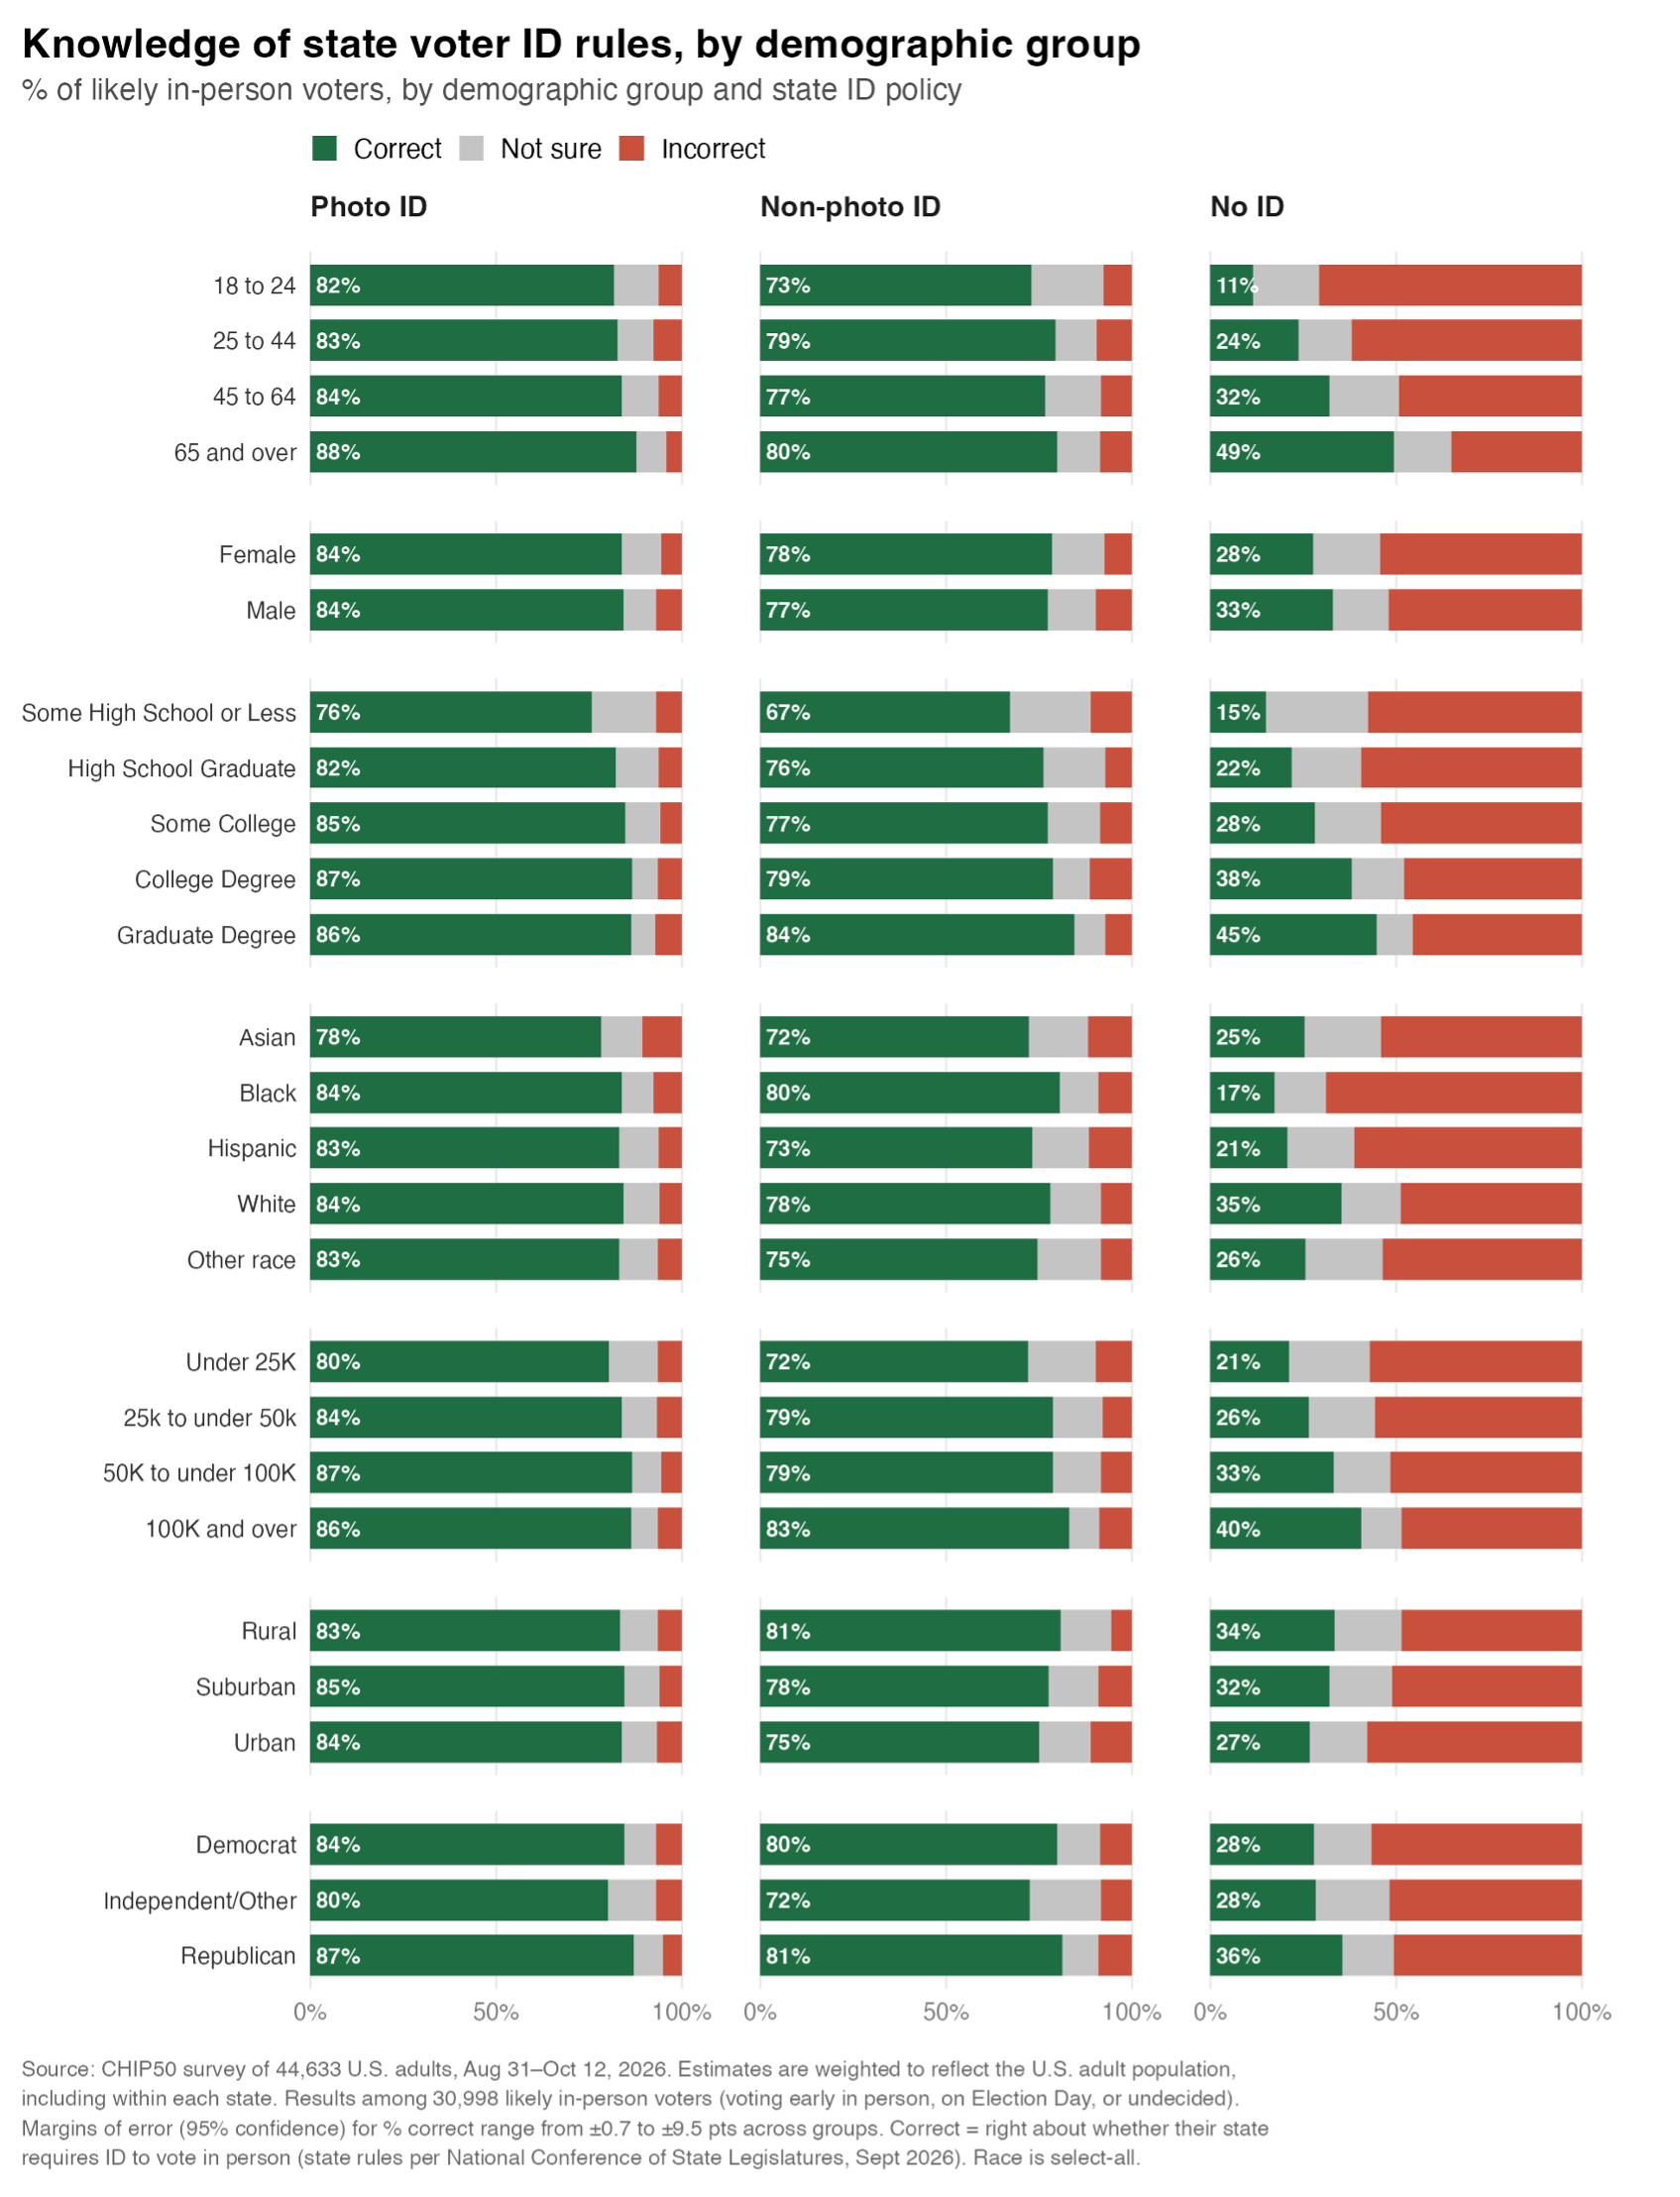
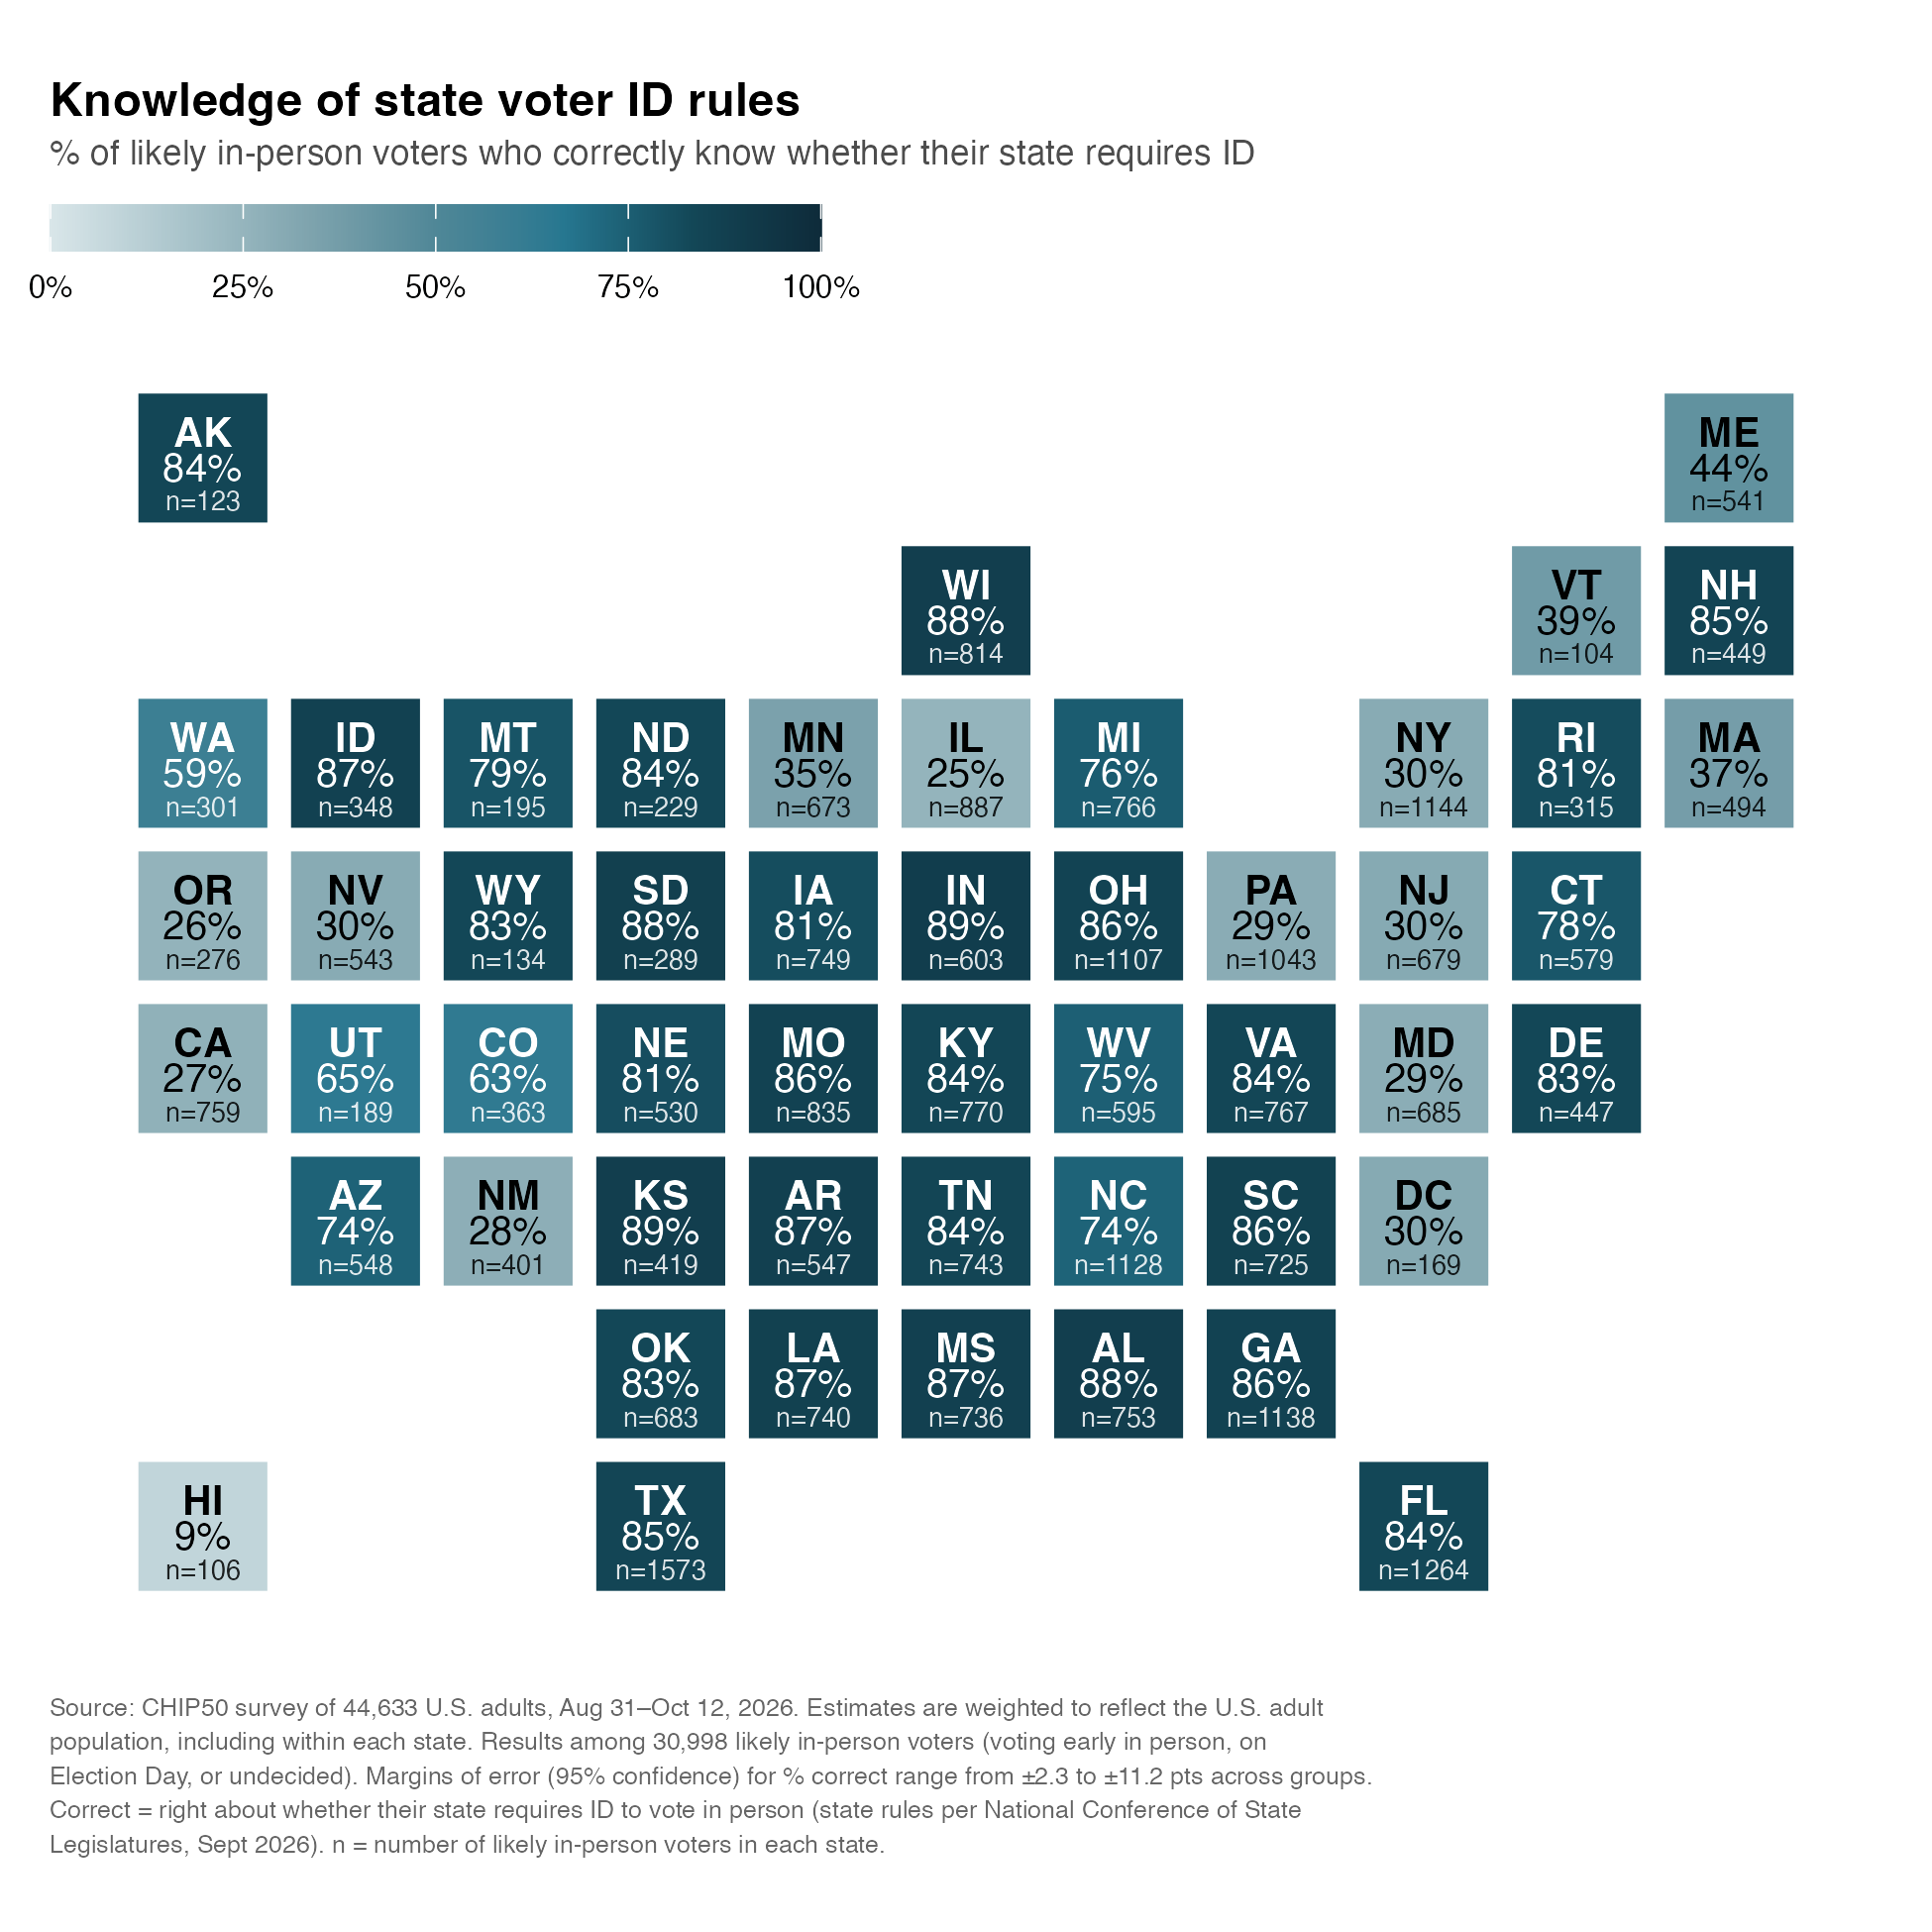
The research also identifies substantial variation from state to state. West Virginia and North Carolina had the lowest accuracy among states requiring photo ID, both places where voter ID policies have changed or been subject to recent legal and political developments. Among states with no ID requirement, Maine had the highest accuracy; voters there rejected a ballot measure that would have imposed a photo ID requirement in 2025.
The survey was conducted from August 31 through October 12, 2026, and included 44,663 adults across all 50 states and the District of Columbia. Surveys were conducted by PureSpectrum using an online nonprobability sample and reweighted within each state to reflect demographic characteristics including 2024 vote choice and turnout, race and ethnicity, age, gender, education and community type.
The analysis of information sources controls for a range of demographic factors, but the researchers caution that the findings show associations rather than causal effects.
The report is part of the 2026 Voting Information Trends Reports, produced by the Shorenstein Center in collaboration with the National Internet Observatory at Northeastern University, the Ash Center for Democratic Governance and Innovation at Harvard Kennedy School, and the Civic Health and Institutions Project.
Visit the 2026 Voting Information Trends landing page to read all reports and explore the interactive dashboard.
Reports & Papers
Reports & Papers